Meteorological spring 2024 began on March 1 and ended on May 31. During spring, there was a wide range in precipitation totals across Kansas, from less than 1 to more than 20 inches. In this report we take a closer look at the varied precipitation totals that fell across the state during the past three months.
A contour plot of total spring precipitation (Fig. 1) shows two standout features in different corners of the state: high totals in the southeast and low totals in the southwest. In the southeast, most locations picked up between 10 and 15 inches of precipitation, with isolated amounts of over 20 inches. The plot suggests Bourbon County was the only county where over 20 inches fell, but this amount was also exceeded in Allen, Crawford, and Elk Counties. Amounts from 15 to 20 inches were observed in eight additional counties: Cherokee, Cowley, Labette, Linn, Neosho, Riley, and Wilson. The highest reported total for spring was 22.31” by the cooperative observer at Longton in Elk County (Table 1). Much of this fell within roughly a 2-week period; between April 25 and May 7, Longton picked up 14.25” of rain. Within this period, April 28 was the wettest day when 6.90” was observed. There were higher totals on that day nearby; Fredonia in Wilson County recorded 8.50”. This was the second-wettest day in 132 years of records at Fredonia, behind only an 11.76” deluge that fell on June 30, 2007. Three-day totals from April 26 through April 28 exceeded 8 inches in five counties: Allen, Anderson, Bourbon, Neosho, and Wilson. The highest amount for that 3-day period was 11.13”, as measured by the cooperative observer in Fort Scott. This amount was the city’s highest 3-day total in over a quarter-century. The Marmaton River at Fort Scott crested at 47.02 feet on the afternoon of the 28th, just over 9 feet above flood stage and 4 feet over the threshold of 43 feet for major flooding. Many roads were flooded in and around Fort Scott due to the deluge.
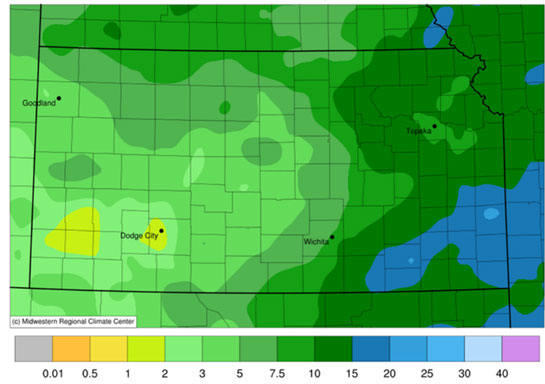
Figure 1. Total precipitation from March 1 through May 31, 2024. Source: Midwest Regional Climate Center.
Table 1. The highest and lowest precipitation totals (inches) in Kansas for the period March 1-May 31, 2024. Reports are from CoCoRaHS observers except where otherwise noted.
|
Station Name |
County |
Amount (inches) |
Station Name |
County |
Amount (inches) |
|
Longton (COOP) |
Elk |
22.31 |
Grant (Mesonet) |
Grant |
0.86 |
|
Devon 0.1 SE |
Bourbon |
22.26 |
Ulysses 0.9 NW |
Grant |
1.27 |
|
Fort Scott 9.3 NNE |
Bourbon |
20.55 |
Dodge City 2.0 NNW |
Ford |
1.29 |
|
Humboldt (COOP) |
Allen |
20.49 |
Moscow 10 NW (Mesonet) |
Stevens |
1.29 |
|
Welda 3 E (Mesonet) |
Anderson |
20.37 |
Lakin (COOP) |
Kearny |
1.30 |
|
Pittsburg (COOP) |
Crawford |
20.01 |
Deerfield 0.6 NE |
Kearny |
1.31 |
|
Fort Scott 0.6 W |
Bourbon |
19.04 |
Stanton (Mesonet) |
Stanton |
1.32 |
|
Grenola 1 N (COOP) |
Elk |
18.63 |
Johnson City 2.9 NNW |
Stanton |
1.37 |
|
Pittsburg 2.2 E |
Crawford |
18.21 |
Dodge City 2.1 N |
Ford |
1.39 |
|
Parsons 2 NW (COOP) |
Labette |
17.80 |
Satanta (Mesonet) |
Seward |
1.43 |
|
Erie 0.4 NNW |
Neosho |
17.73 |
Dodge City 4.0 SW |
Ford |
1.50 |
|
Fredonia (COOP) |
Wilson |
17.59 |
Garden City Arpt. (WBAN) |
Finney |
1.58 |
|
Parsons (Mesonet) |
Labette |
17.45 |
Holcomb 0.5 SSE |
Finney |
1.59 |
|
Uniontown 3 NW (Mesonet) |
Bourbon |
17.34 |
La Crosse (Mesonet) |
Rush |
1.59 |
|
Columbus (COOP) |
Cherokee |
17.26 |
Roth Tech Farm (Mesonet) |
Finney |
1.59 |
In southwest Kansas, the problem was a lack of precipitation, as this area had the lowest spring precipitation totals in the state. Two inches or less was measured by observers in nine counties: Finney, Ford, Grant, Gray, Hamilton, Hodgeman, Kearny, Seward, and Stanton. The lowest total was 0.86” in Grant County, as reported by the Kansas Mesonet site 4 miles north of Ulysses. Dodge City’s official total of 1.77” for the period March 1 through May 31 is the third lowest on record in 150 years and the lowest spring total in well over a century since a total of 1.35” set the record for driest spring back in 1893. While Garden City’s official total was lower (1.58”) than Dodge City’s, spring 2024 ranks as their sixth driest on record. Interestingly, four of the five driest springs in Garden City have occurred since 2013, including just two years ago in 2022, when there was less than an inch of precipitation (0.95”). Despite the low totals, southwest Kansas did not have the biggest precipitation deficits. A look at the departures from normal precipitation map (Fig. 2) shows that it was not the southwest but central and south central Kansas that were the most below normal.
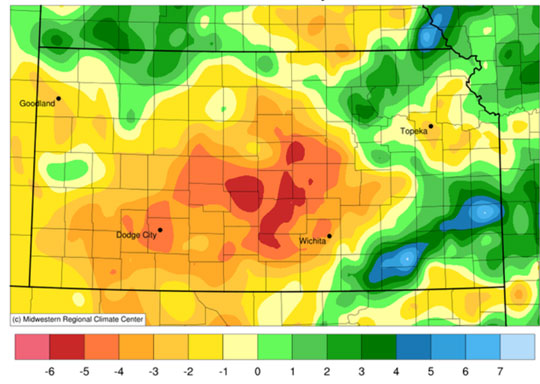
Figure 2. Departure from normal precipitation from March 1 through May 31, 2024. Source: Midwest Regional Climate Center.
The National Centers for Environmental Information (NCEI) calculates average monthly precipitation totals for every county in the United States. The preceding month’s data are typically released within two weeks after a month ends. Not only are the most recent month’s data made available for the first time, but adjustments to earlier months are often made based on additional data received after a month’s initial release. The county-specific data presented below are based on NCEI’s March, April, and May numbers that were released on June 10. In addition to recent data, NCEI has calculated monthly averages back to 1895, thereby creating a valuable database that compares recent precipitation amounts to historical totals.
A look at county averages (Table 2) during the spring months reflect climatology, with counties in the east wettest and those in the west driest. Of the three months, April had the widest range in precipitation totals. Bourbon County’s 11.06” was their second wettest April on record; only 1994 had a higher average (14.77”). It was the third wettest April on record in Allen County and fifth wettest in Wilson County. April was the driest on record in seven counties: Barton, Edwards, Ellsworth, Ford, Hodgeman, Pawnee, and Rice. When all three months are summed and compared to normal (Table 3), we see extremes like those depicted in the graphics: southeast Kansas had the highest and most above-normal totals, with Bourbon County leading in both categories. Haskell County in southwest Kansas was driest, and McPherson County was the most below normal. Only 24 counties were above normal for spring. Of the 81 counties below normal, about half of them (42) were at least 2 inches below normal, with 23 at least 3 inches below normal. The statewide average precipitation for spring 2024 was 7.19”, or 1.50” below normal. This ranked as the 52nd driest spring of the last 130 years.
Table 2. The ten wettest (green shading) and driest counties (yellow shading) in Kansas for March, April, and May 2024. Source: NCEI.
|
March 2024 |
April 2024 |
May 2024 |
|||
|
Precip. (inches) |
County |
Precip. (inches) |
County |
Precip. (inches) |
County |
|
2.49 |
Woodson |
11.06 |
Bourbon |
7.51 |
Marshall |
|
2.21 |
Allen |
9.82 |
Allen |
7.43 |
Riley |
|
2.18 |
Crawford |
9.05 |
Wilson |
7.26 |
Elk |
|
2.17 |
Doniphan |
8.89 |
Neosho |
7.15 |
Pottawatomie |
|
2.16 |
Bourbon |
8.27 |
Linn |
7.07 |
Chautauqua |
|
2.08 |
Chase |
8.11 |
Anderson |
6.61 |
Crawford |
|
2.05 |
Coffey |
7.91 |
Crawford |
6.46 |
Cherokee |
|
2.01 |
Lyon |
7.46 |
Elk |
6.26 |
Cowley |
|
1.95 |
Montgomery |
7.14 |
Cherokee |
6.21 |
Nemaha |
|
1.95 |
Labette |
6.88 |
Woodson |
6.05 |
Harper |
|
0.07 |
Comanche |
0.04 |
Hodgeman |
1.65 |
Haskell |
|
0.10 |
Kiowa |
0.05 |
Gray |
1.73 |
Seward |
|
0.11 |
Barber |
0.05 |
Pawnee |
1.83 |
Gray |
|
0.11 |
Clark |
0.06 |
Edwards |
1.90 |
Grant |
|
0.12 |
Pawnee |
0.06 |
Ford |
1.90 |
Meade |
|
0.13 |
Meade |
0.08 |
Finney |
1.99 |
Sherman |
|
0.13 |
Pratt |
0.08 |
Haskell |
2.02 |
Finney |
|
0.13 |
Stanton |
0.09 |
Seward |
2.02 |
Stevens |
|
0.14 |
Stafford |
0.15 |
Barton |
2.07 |
Morton |
|
0.15 |
Hamilton |
0.15 |
Ness |
2.13 |
Stanton |
Table 3. The ten wettest, driest, most above, and most below counties in Kansas for spring 2024. Source: NCEI. Positive values indicate the amount (inches) of precipitation above normal; negative values indicate the amount of precipitation below normal.
|
Wettest |
Driest |
Most Above Normal |
Most Below Normal |
||||
|
Precip. (inches) |
County |
Precip. (inches) |
County |
(inches) |
County |
(inches) |
County |
|
18.62 |
Bourbon |
1.94 |
Haskell |
+5.20 |
Bourbon |
-4.88 |
McPherson |
|
16.74 |
Allen |
2.04 |
Seward |
+4.03 |
Elk |
-4.78 |
Rice |
|
16.70 |
Crawford |
2.07 |
Gray |
+3.75 |
Allen |
-4.56 |
Reno |
|
16.48 |
Elk |
2.21 |
Meade |
+2.75 |
Wilson |
-4.46 |
Harvey |
|
15.75 |
Neosho |
2.29 |
Grant |
+2.48 |
Crawford |
-4.40 |
Ellsworth |
|
15.64 |
Wilson |
2.44 |
Morton |
+2.31 |
Anderson |
-4.30 |
Saline |
|
15.51 |
Cherokee |
2.44 |
Stevens |
+2.22 |
Linn |
-3.97 |
Stafford |
|
14.94 |
Linn |
2.47 |
Finney |
+2.15 |
Riley |
-3.87 |
Kingman |
|
14.92 |
Chautauqua |
2.54 |
Stanton |
+2.10 |
Pottawatomie |
-3.85 |
Meade |
|
14.62 |
Anderson |
2.86 |
Kearny |
+2.09 |
Chautauqua |
-3.80 |
Marion |
The effect of the unequal distribution of precipitation across Kansas is evident in the US Drought Monitor. As of May 28 (Fig. 3 top), 32 of Kansas’ 105 counties are completely drought-free, all in the eastern one-fourth of the state. The southwest quarter of the state ranges from D1 to D3 drought status, with the worst conditions (D3) in parts of seven counties: Finney, Ford, Hodgeman, Kearny, Ness, Pawnee, and Rush. It’s important to note that conditions were much worse last year. Only 27% of Kansas is currently in D2 or worse status; 72% of Kansas was D2 or worse just one year ago, with nearly 32% of the state in D4, the most severe category. While we are better off this year, the descent into drought has been quick; some locations worsened by as much as 4 categories (Fig. 3 bottom) during spring. All of the current D3 areas were drought-free just three months ago.
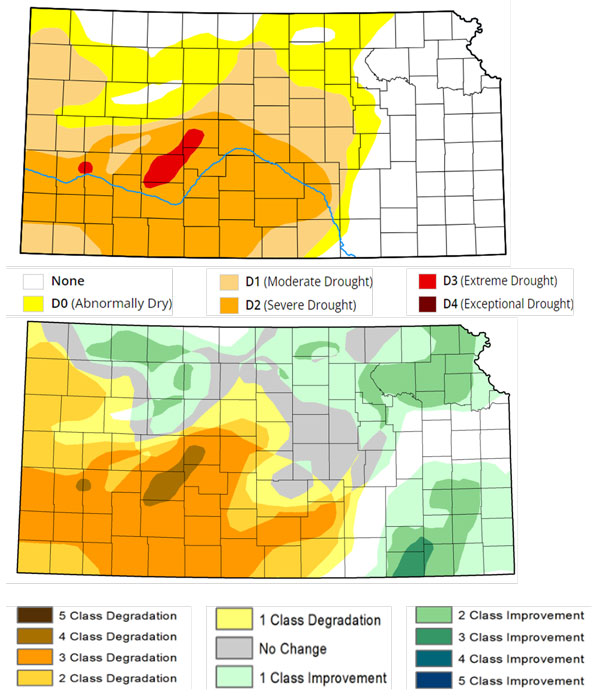
Figure 3. Weekly drought status as of May 28, 2024 (top) and the change in category over the past 3 months (bottom) for Kansas. Source: U.S. Drought Monitor.
Fortunately, the start of meteorological summer has been wet for southwest Kansas. All seven Ford County observers listed in Table 1 have picked up more precipitation since June 1 than they did in all of spring! The official Dodge City observation site has more than tripled its spring precipitation total, having picked up 5.69” since June. A continuation of this trend would be most welcome in southwest Kansas, as more precipitation would continue to improve drought conditions. The last time the entire state of Kansas was drought-free was nearly 5 years ago, in July 2019. And while we’re not there yet, June has so far been a step in the right direction after a very dry spring.
Matthew Sittel, Assistant State Climatologist
msittel@ksu.edu
Tags: spring weather precipitation rainfall