July is typically the hottest month in Kansas, and this year has been no exception. Statewide, the average temperature (degrees F) for July 2022 was 80.8°, or 2.0° above normal. This July ranks as the 29th warmest on record, dating back to 1895. June 2022 was above normal as well, ranking as 34th warmest.
Many locations in Kansas have dealt with bouts of extreme heat this summer, often as long stretches of high temperatures lasting for weeks. The COOP observer in Ashland (Clark County) has reported 30 days of highs at or above 100° (we will term this “100° days” in this report, with references to other thresholds similarly phrased) this year as of July 31. The Kansas Mesonet site at Meade recorded 30 consecutive 90° days, from June 30 to July 29. Have there been more hot days than normal this year in Kansas? Let’s take a closer look.
Summer temperatures at 40 locations in Kansas
The data in this report are based on the period 1991-2020. For each of 40 locations across the state, the total number of days with high temperatures at or exceeding four different temperature thresholds (90°, 95°, 100° and 105°) during this 30-year period was determined, then averaged to obtain annual counts (Table 1). Next to the averages are this year’s counts through July 31 for the same four thresholds.
As of July 31, none of the 40 locations have exceeded their average annual number of 90° days, but Chanute has tied their average with 49. At first glance, this might suggest that the heat this year hasn’t been all that unusual. However, at the higher temperature thresholds, evidence that 2022 has been unusually hot becomes clearer. Fourteen of the 40 stations have already exceeded their average number of 95° days. Over 70% of the stations (29 of 40) are above their annual average number of 100° days, and just over half (23 of 40) are above their annual average of 105° days. The only part of Kansas where none of the average counts have been exceeded is in the northeast. For places where the hottest temperature threshold counts are already above annual averages, another month or more of hot days will push those counts even higher. Most locations in Kansas typically see at least half of their daily highs in August reach at least 90° (Table 2). There is a better than even chance of above-normal temperatures in August according to the Climate Prediction Center (Figure 1), so we will certainly add to this year’s totals in the next few weeks before cooler temperatures prevail. Additionally, locations with below-normal counts still have plenty of time to catch up.
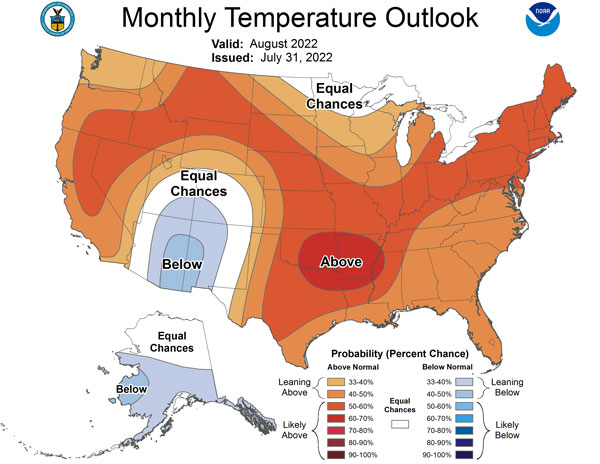
Figure 1. NOAA’s Climate Prediction Center temperature outlook for August 2022.
Record-breaking heat?
Some superlative statistics of note: Healy’s 17 days at or above 105° so far in 2022 already ranks as their 5th highest count on record, dating back to 1901. The most 105° days on record there in a calendar year is 26 days during the Dust Bowl era, in 1934. Dodge City’s 105° days count of 7 is tied for 5th all time, dating back to 1943. Dodge City’s top two years for 105° days, 2011 (26) and 1980 (20), are unlikely to be matched, but a top 5 ranking is still noteworthy, especially when the only years ahead of 2022’s counts are legendary in Kansas climate history for excessive heat. Only time will tell if 2022 ends up ranking as high as those infamous years, but we’re well on our way to such heights for many locations if the August outlook verifies.
Table 1. Average number of days per year with high temperatures exceeding various temperature thresholds. BOLD numbers inside red-shaded cells indicate 2022 counts at or above than their corresponding 30-year averages, while blue-shaded cells are below the 30-year averages.
|
|
30-Year Average (1991-2020) |
2022 Year-to-Date (through July 31) |
|||||||
|
Northwest |
|||||||||
|
Town |
County |
≥ 90° |
≥ 95° |
≥ 100° |
≥ 105° |
≥ 90° |
≥ 95° |
≥ 100° |
≥ 105° |
|
Atwood |
Rawlins |
62 |
35 |
14 |
2.4 |
46 |
37 |
24 |
8 |
|
Colby |
Thomas |
58 |
29 |
9 |
0.9 |
44 |
30 |
18 |
5 |
|
Goodland |
Sherman |
52 |
25 |
6 |
0.6 |
40 |
30 |
14 |
2 |
|
Hill City |
Graham |
69 |
41 |
17 |
4.4 |
47 |
35 |
22 |
8 |
|
North Central |
|||||||||
|
Town |
County |
≥ 90° |
≥ 95° |
≥ 100° |
≥ 105° |
≥ 90° |
≥ 95° |
≥ 100° |
≥ 105° |
|
Clay Center |
Clay |
56 |
26 |
8 |
1.4 |
33 |
20 |
4 |
0 |
|
Concordia |
Cloud |
50 |
23 |
7 |
1.2 |
37 |
21 |
10 |
2 |
|
Minneapolis |
Ottawa |
69 |
37 |
14 |
4.5 |
46 |
25 |
11 |
2 |
|
Smith Center |
Smith |
61 |
32 |
12 |
2.7 |
40 |
20 |
14 |
4 |
|
Washington |
Washington |
55 |
25 |
7 |
0.7 |
29 |
9 |
1 |
0 |
|
Northeast |
|||||||||
|
Town |
County |
≥ 90° |
≥ 95° |
≥ 100° |
≥ 105° |
≥ 90° |
≥ 95° |
≥ 100° |
≥ 105° |
|
Holton |
Jackson |
38 |
13 |
4 |
0.4 |
28 |
9 |
1 |
0 |
|
Horton |
Brown |
43 |
15 |
4 |
0.3 |
27 |
8 |
0 |
0 |
|
Manhattan |
Riley |
59 |
28 |
10 |
2.1 |
31 |
13 |
3 |
0 |
|
Marysville |
Marshall |
45 |
18 |
5 |
0.5 |
27 |
6 |
0 |
0 |
|
Wamego |
Pottawatomie |
49 |
19 |
6 |
1.0 |
31 |
11 |
1 |
0 |
|
West Central |
|||||||||
|
Town |
County |
≥ 90° |
≥ 95° |
≥ 100° |
≥ 105° |
≥ 90° |
≥ 95° |
≥ 100° |
≥ 105° |
|
Healy |
Lane |
71 |
40 |
15 |
2.8 |
57 |
40 |
28 |
17 |
|
Oakley |
Logan |
60 |
33 |
11 |
1.3 |
41 |
30 |
21 |
6 |
|
Tribune |
Greeley |
65 |
37 |
12 |
1.6 |
40 |
30 |
12 |
1 |
|
WaKeeney |
Trego |
66 |
37 |
14 |
2.7 |
42 |
27 |
18 |
7 |
|
Hays |
Ellis |
66 |
36 |
15 |
4.1 |
46 |
27 |
17 |
8 |
|
Central |
|||||||||
|
Town |
County |
≥ 90° |
≥ 95° |
≥ 100° |
≥ 105° |
≥ 90° |
≥ 95° |
≥ 100° |
≥ 105° |
|
Lincoln |
Lincoln |
69 |
38 |
17 |
5.2 |
41 |
23 |
19 |
1 |
|
McPherson |
McPherson |
64 |
31 |
11 |
2.3 |
44 |
32 |
13 |
1 |
|
Russell |
Russell |
64 |
34 |
13 |
3.0 |
46 |
26 |
14 |
4 |
|
Salina |
Saline |
69 |
38 |
16 |
4.4 |
44 |
28 |
11 |
3 |
|
East Central |
|||||||||
|
Town |
County |
≥ 90° |
≥ 95° |
≥ 100° |
≥ 105° |
≥ 90° |
≥ 95° |
≥ 100° |
≥ 105° |
|
Emporia |
Lyon |
44 |
17 |
5 |
0.8 |
41 |
19 |
5 |
0 |
|
Garnett |
Anderson |
46 |
17 |
4 |
0.5 |
35 |
16 |
0 |
0 |
|
Lawrence |
Douglas |
43 |
16 |
5 |
0.3 |
39 |
20 |
5 |
0 |
|
Topeka |
Shawnee |
50 |
20 |
6 |
1.0 |
42 |
20 |
7 |
0 |
|
Southwest |
|||||||||
|
Town |
County |
≥ 90° |
≥ 95° |
≥ 100° |
≥ 105° |
≥ 90° |
≥ 95° |
≥ 100° |
≥ 105° |
|
Ashland |
Clark |
84 |
52 |
23 |
5.8 |
61 |
44 |
30 |
13 |
|
Dodge City |
Ford |
71 |
38 |
14 |
2.5 |
58 |
41 |
24 |
7 |
|
Garden City |
Finney |
68 |
35 |
11 |
1.3 |
51 |
37 |
18 |
5 |
|
Liberal |
Seward |
80 |
47 |
16 |
1.9 |
59 |
45 |
24 |
9 |
|
Syracuse |
Hamilton |
75 |
42 |
14 |
2.0 |
60 |
40 |
22 |
8 |
|
South Central |
|||||||||
|
Town |
County |
≥ 90° |
≥ 95° |
≥ 100° |
≥ 105° |
≥ 90° |
≥ 95° |
≥ 100° |
≥ 105° |
|
Anthony |
Harper |
70 |
36 |
14 |
2.4 |
50 |
36 |
15 |
3 |
|
Hutchinson |
Reno |
63 |
31 |
11 |
2.5 |
56 |
37 |
17 |
3 |
|
Pratt |
Pratt |
65 |
34 |
13 |
2.7 |
51 |
33 |
14 |
3 |
|
Wichita |
Sedgwick |
65 |
32 |
12 |
2.8 |
48 |
28 |
14 |
2 |
|
Southeast |
|||||||||
|
Town |
County |
≥ 90° |
≥ 95° |
≥ 100° |
≥ 105° |
≥ 90° |
≥ 95° |
≥ 100° |
≥ 105° |
|
Chanute |
Neosho |
49 |
20 |
5 |
0.8 |
49 |
30 |
13 |
3 |
|
Coffeyville |
Montgomery |
63 |
28 |
10 |
2.3 |
47 |
32 |
18 |
4 |
|
Pittsburg |
Crawford |
55 |
21 |
5 |
0.6 |
38 |
25 |
9 |
1 |
|
Winfield |
Cowley |
65 |
30 |
12 |
2.7 |
50 |
29 |
16 |
4 |
Table 2. Average number of days with highs greater than or equal to 90°F during the first 7 months of the year (based on 1991-2020 data), the actual counts for the first 7 months of 2022, and the average number of 90° days in the month of August for the same 30-year period.
|
Region |
Town |
Jan.-Jul. |
2022 YTD |
August Average |
|
Northwest |
Goodland |
31 |
40 |
14 |
|
North Central |
Concordia |
30 |
37 |
13 |
|
Northeast |
Manhattan |
34 |
31 |
16 |
|
West Central |
Oakley |
34 |
41 |
15 |
|
Central |
Salina |
41 |
44 |
18 |
|
East Central |
Topeka |
29 |
42 |
15 |
|
Southwest |
Dodge City |
41 |
58 |
19 |
|
South Central |
Wichita |
38 |
48 |
18 |
|
Southeast |
Chanute |
27 |
49 |
17 |
Stay tuned!
Watch for a future report with final counts for 2022 in the fall. In the meantime, the Kansas Mesonet is a great resource for tracking the heat of summer at over 75 locations across the state. Visit us on the web at http://mesonet.k-state.edu.
Matthew Sittel, Assistant State Climatologist
msittel@ksu.edu
Christopher “Chip” Redmond, Kansas Mesonet Manager
christopherredmond@k-state.edu