Summer brings heat, often amplified by humidity. Recent rains across the state and more in the short-term forecast (Figure 1), much of it in drought-stricken regions, have increased atmospheric and surface moisture. When we factor in warmer-than-normal temperatures, especially at night, heat stress can rapidly develop in humans and animals alike. It's been nearly two years since a major cattle loss event occurred in southwest Kansas. This marked a time when producers were caught off guard by a sudden transition from cool/wet to hot conditions.
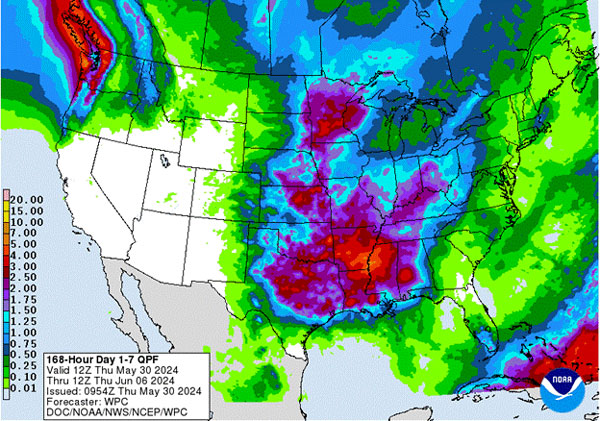
Figure 1. Seven day estimated precipitation from the Weather Prediction Center (https://www.wpc.ncep.noaa.gov).
When heat stress develops with hot, sunny, and humid conditions, increased proactive steps are required to avoid potential illness. This is compounded when heat stress values remain elevated for long periods of time. Of special importance is the animal’s ability to recover at night. High temperatures overnight prevent the body from recovering from the previous day’s heat and can compound the next day’s stress if not mitigated.
The Kansas Mesonet has an Animal Comfort Tool that tracks current heat stress values with real-time data and looks ahead at the 7-day forecast, helping farmers stay one step ahead of potential issues.
Users can access this tool from the main Mesonet page (https://mesonet.k-state.edu/) by selecting “Agriculture” from the drop-down menu on the top left of every page and then “Comfort Index” (Figure 2). Also, users can access the tool directly from this link: http://mesonet.k-state.edu/agriculture/animal/
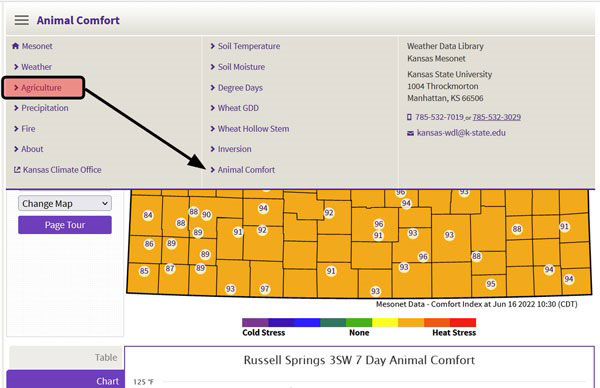
Figure 2. Screenshot of the menu path to the Animal Comfort Index page on the Kansas Mesonet.
Utilizing the Forecast Animal Comfort Index
This product utilizes the National Weather Service hourly forecast (averaged over the hour, meaning extremes could be slightly more) for the next seven days. This data consisting of solar, wind, temperature, and humidity is utilized in the Comprehensive Comfort Index equation from the University of Nebraska. The ability to handle both hot and cold extremes provides a year-round product to increase producer awareness in advance of critical weather. Data is displayed on a graph and a summarized table (Figure 3), allowing quick analysis of conditions on desktop and mobile browsers in an easy-to-read format.
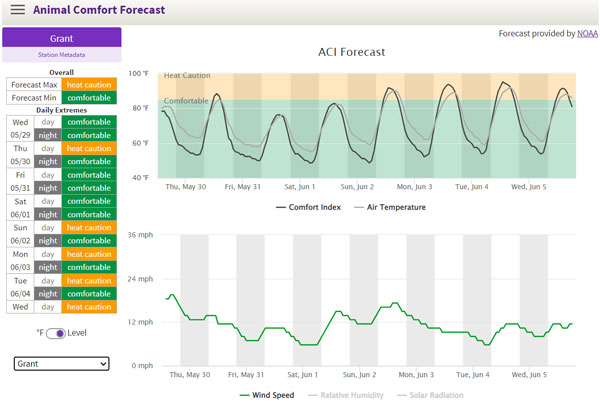
Figure 3. The Animal Comfort Forecast in advance of increased warm and humidity late this coming weekend and into early next week.
It is important to note that the forecast is only a guidance product. Forecasts are subject to change, and conditions could vary significantly based on numerous external factors. Actual animal response to temperature stress will depend on several factors not accounted for in the index. Those include but are not limited to age, hair coat (winter vs. summer; wet vs. dry), health, body condition, micro-environment, and acclimatization. Additionally, recent moisture can result in mud, increasing livestock stress levels.
Important note: The National Weather Service forecasts hourly average values rather than extremes. In addition, fluctuations in cloud cover (which affects solar radiation) and wind speed have a large effect on comfort levels. Producers should recognize that localized conditions may be significantly warmer/cooler than the predicted comfort index.
Tracking conditions with current data
One of the most basic ways to verify a forecast is to look at current conditions. The original Animal Comfort product remains to allow producers to see the real-time weather stress at the nearest Mesonet location. This displays both the current data up to (fifteen-minute intervals).
Users can scroll down the page and view the previous seven days' hourly data on the “Chart” (Figure 4). This is particularly useful for producers that suffered loss and want to capture the conditions that took place in the previous week. You can also download the data in a comma-delimited form for use in Excel or similar software. This can be found under the “Download” tab.
No historical data download is available beyond the last seven days, so this information must be captured quickly.
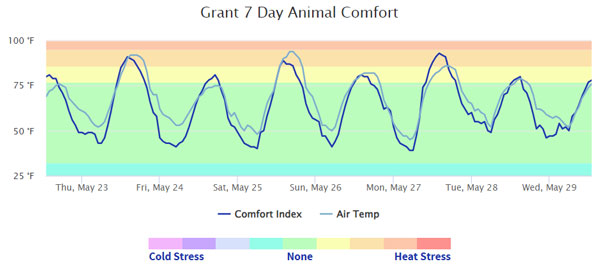
Figure 4. Animal Comfort Index history at the Mesonet station in Grant. Graphic from Kansas Mesonet.
The displayed data does not consider conditions compared to “normal.” Solar radiation, wind, and humidity data are hard to put into a climatological (or long-term) perspective since recorded data is relatively new (only about 15 years of data at most stations). Thus, climatological data is limited for the animal comfort index. If you need historical data, please contact our staff at Kansas-wdl@ksu.edu, and we’d be glad to pull older data that may exist.
If you want to read more about the Forecast or Current Conditions pages, please visit https://mesonet.ksu.edu/agriculture/animal and scroll down to the “Resources” tab.
Christopher “Chip” Redmond, Kansas Mesonet Manager
christopherredmond@ksu.edu
Matthew Sittel, Assistant State Climatologist
msittel@ksu.edu
Tags: cattle Mesonet Cattle Comfort Tool heat stress high humidity