The morning of October 8 saw the first fall freeze in the state occurring in northeast Kansas. Hiawatha became the first location to record not only a freeze, but a hard freeze. Washington also marked the end of the growing season that morning. The Kansas Mesonet’s Freeze Monitor (https://mesonet.k-state.edu/airtemp/min/hoursbelow/) is available for the 2022 fall frost/freeze season. The Freeze Monitor is a handy tool to check conditions in your area. Have freezing conditions been recorded? How does it compare to average? How many hours below freezing was your area?
The average freeze date in northwest Kansas is as early as the last week in September. However, southeast Kansas does not usually see freezing temperatures until the end of October (Figure 1). You can find the average first freeze dates by location here: https://mesonet.k-state.edu/airtemp/min/hoursbelow/#tab=table-tab&mtIndex=6. Average dates for the first occurrence of 24 °F temperatures are even later (Figure 2).
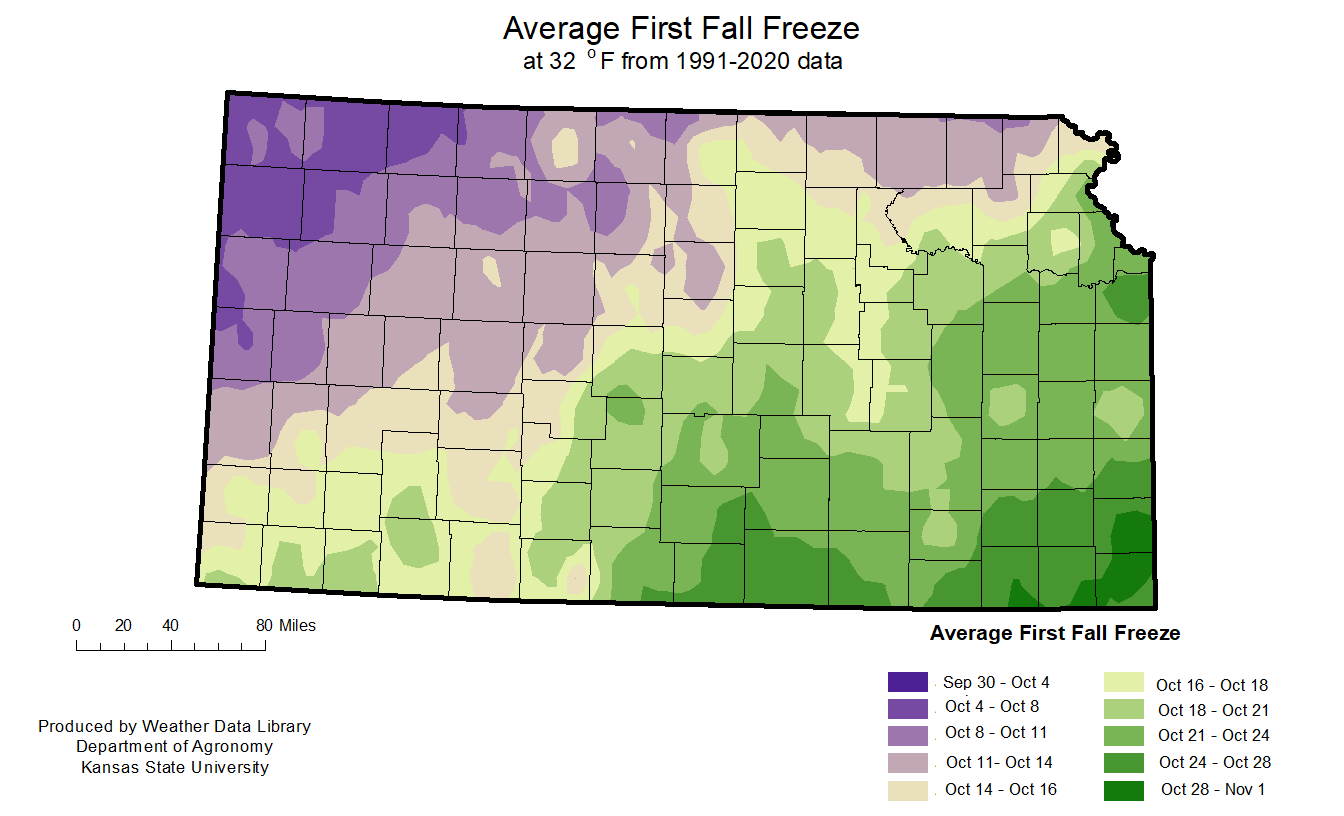
Figure 1. Average fall freeze dates (Weather Data Library).
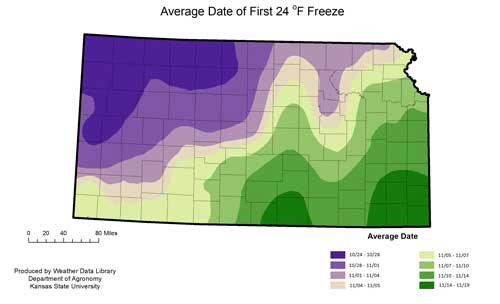
Figure 2. Average 24 oF freeze dates (Weather Data Library).
Historically, almost all parts of the state have recorded freezing temperatures as early as September. Earliest first freeze on record in Kansas is September 3, 1974, when many stations dropped below freezing. This year, the first freeze is starting to fall behind normal as much of the northwest haven’t seen freezing conditions.
The Freeze Monitor tool displays the coldest temperatures observed across Kansas during the previous two weeks (the most recent freeze event during the previous two weeks is displayed). It answers the frequent question: How cold did it get? (Figure 3). It also tracks the first fall freeze date for each station for comparison to local climatology in a table (https://mesonet.k-state.edu/airtemp/min/hoursbelow/#tab=table-tab&mtIndex=6). Data updates every twenty minutes on both the map and the table.
Another tool important for producers and gardeners is the duration below freezing, as some crops and commodities have lower thresholds for damage. This feature address the common: Was it cold long enough to damage crops question, allowing users to select options to view maps/data of the “hours below 32°F”, “hours below 24°F”, and the “hours below 12°F”). While all three are of interest, the lower two thresholds are of great importance to wheat growers later into the fall/winter season.
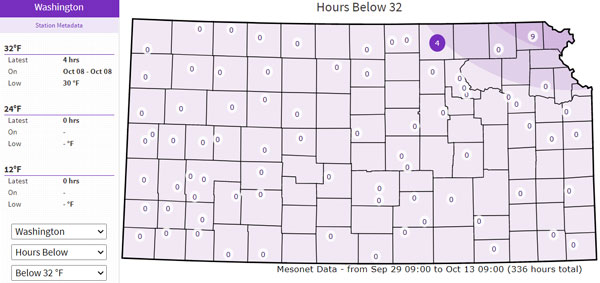
Figure 3. View of the Freeze Monitor webpage on October 13, 2022. Washington (selected station) is showing a freeze event that occurred on October 8, 2022. The map represents the latest freeze events at these locations since September 29, 2022. Source: https://mesonet.k-state.edu/airtemp/min/hoursbelow/#tab=table-tab&mtIndex=0
As the growing season concludes, the freeze monitor can also answer the question: How long have we been above freezing? The freeze monitor also has the ability to track the duration of days since the last freeze or below the 24F and 12F threshold. This is great for the first freeze and determining the length of the growing season. You can find “days since” using this link: https://mesonet.k-state.edu/airtemp/min/hoursbelow/#tab=table-tab&mtIndex=6. Much of the state hasn’t seen a freeze since late April in the state of Kansas – a growing season between 160-180 days for 2022 (Figure 4).
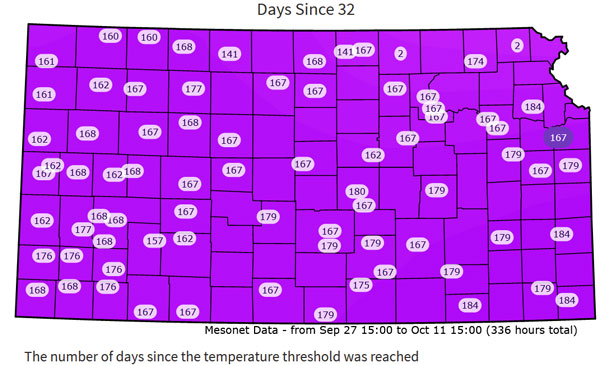
Figure 4: Number of days since last freeze as of October 11, 2022. Find this information here: https://mesonet.k-state.edu/airtemp/min/hoursbelow/#tab=table-tab&mtIndex=6.
The data displayed in the tables below the maps can be sorted. Clicking on the header of a particular column will sort the table by that column. This makes it much easier to see what area was the coldest in the state, as well as the earliest freeze and earliest climatological freeze data. There are a number of download options, including table and chart data, and images of the maps (Figure 5).
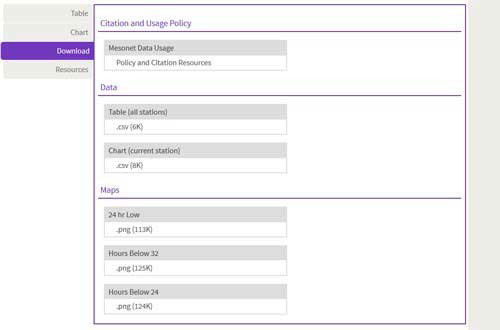
Figure 5. Download options on the Freeze Monitor website.
The Freeze Monitor is operational through the winter and available to be used for the 24F and 12F thresholds in addition to 32F. The product will be updated as we near the spring to present the spring freeze climatology.
Chip Redmond, Weather Data Library/Mesonet
christopherredmond@ksu.edu
Dan Regier, Weather Data Library/Mesonet
regierdp@ksu.edu