The latest USDA-National Agricultural Statistics Service crop progress and condition report released September 19, 2022 classified 51% of the soybean crop to be in fair or good condition. Overall, 40% of all soybeans in Kansas are dropping leaves, ahead of 34% from last year and the average .
Weather outlook
The weather conditions expected for the last portion of September will be critical for soybeans as related to seed filling and determining final seed weight.
Current conditions have been much warmer than normal thus far in September. In addition, current forecast projections favor high confidence in continued warmth the remainder of September and into early October. While there are some chances for moisture, they will remain limited to the next few days with below-normal precipitation also significantly favored into early October. Seasonally, we continue the weekly decrease in normal precipitation as we head towards the driest season of the year (winter). As a result, below-average precipitation unfortunately means potentially very little, if any, moisture. Warm and dry conditions will favor overall low humidity, increasing drought and wide day/night temperature swings.
Soybean seed-filling
Soybeans will reach final maturity with high seed water content, moving from 75-80% (R6) to around 50% (R7) from beginning of seed filling until final maturity (Figure 1). Final maturity is defined as the formation of the black layer in the seeds. The process of seed dry matter accumulation and moisture changes will depend on the maturity group (affecting the length of the season), planting date, and weather conditions experienced during the latter part of the reproductive phase.
As described for corn, seed water loss for soybeans can also divided in two phases: 1) before “black layer” or maturity, and 2) after black layer.
The overall contribution of seed weight to final yields can be study by evaluating changes in seed weight during the seed filling period, building a dataset portraying the rate and duration of the changes in seed filling (Figure 2). In the example presented below, overall seed filling last more than one month (37 days) until black layer (no changes in seed weight) was achieved. to the graph of seed filling provides a visual of the overall rate, increase in seed weight per day, and the duration of the seed filling (Figure 2), with this information we can improve our understanding of potential impacts of stress conditions during this time of the season for soybeans. In the example presented in Figure 2 you can see the impact that decreasing the effective duration of the seed filling period has in the final yield, if the duration is reduced by one week (from 37 to 30 days) the attainable yield went from 61 to roughly 50 bushels per acre. Potential impacts (beyond the current heat/drought) on leaf green area imposed by insects, diseases, hailstorm, and any other abiotic stress conditions such as cloudy days and early frost impacting the crop during the coming weeks will negatively affect the seed filling conditions for soybeans.
For this current season, we can expect large yield impacts due to the current heat + drought conditions, resulting in poor seed weight. In overall, seed weight contributes roughly in 30-40% of the final total yield for this crop, emphasizing the impacts of the stress conditions on the attainable yields.
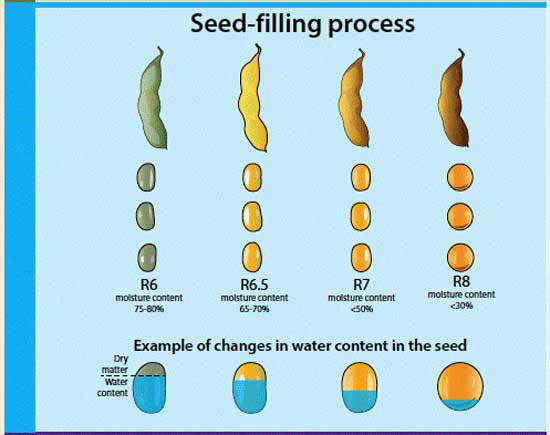
Figure 1. Soybean seed filling process from full seed to full maturity. Photo and infographic prepared by Ignacio Ciampitti, K-State Research and Extension. Taken from Soybean Growth and Development, MF3339.
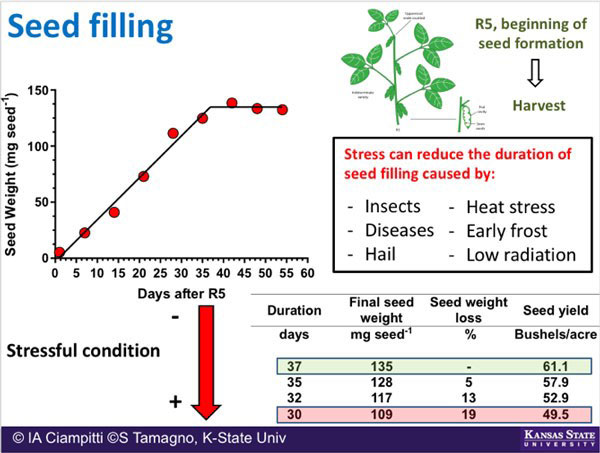
Figure 2. Soybean seed weight changes from beginning of seed filling (R5) to full maturity. Photo and infographic prepared by Ignacio Ciampitti and Santiago Tamagno, K-State Research and Extension.
Soybean dry down
Soybeans will reach final maturity with high seed water content, moving from 90% to around 60% from beginning of seed filling until final maturity. Final maturity is defined as the formation of the black layer in the seeds. The dry down rate will depend on the maturity group (affecting the length of the season), planting date, and weather conditions experienced during the latter part of the reproductive phase.
To address the question related to the dry down rate for soybeans, a study was conducted to investigate the changes in water content from black layer formation (maturity) until harvest time (Figure 2). During the last days of September and mid-October 2016, the overall dry down rate was around 3% per day (from 58% to 12% seed moisture) – taking an overall period of 15 days.
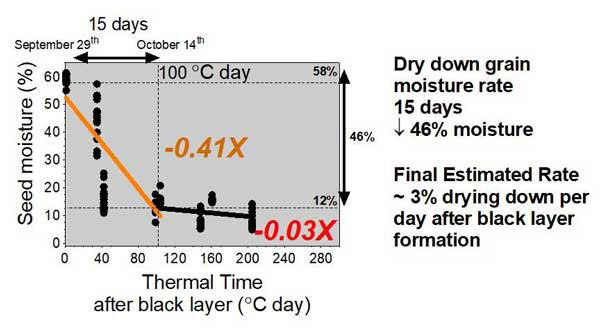
Figure 3. Grain moisture dry down (orange line) across three hybrids and different N rates near Manhattan, KS. Horizontal dashed lines marked the 58% seed moisture at black layer formation. * Graph prepared by Ignacio Ciampitti, K-State Research and Extension.
*Note: It is desired to reach harvest with 13% seed moisture to maximize the final seed volume to be sold, thus the importance of timing harvest with the right seed moisture content.
Soybean dry down rate was three-time faster, 3% per day, relative to corn at 1% per day. These dry down rates for corn and soybeans are primarily affected by temperature, humidity, and overall water content at the point of black layer formation (maturity). These main factors should be considered when the time comes to schedule soybean harvest.
Ignacio A. Ciampitti, Farming Systems
ciampitti@ksu.edu
Adrian Correndo, Postdoctoral fellow
correndo@ksu.edu
Christopher “Chip” Redmond, Kanas Mesonet Manager
christopherredmond@ksu.edu