An impressive and much needed snow storm occurred on January 25, 2022. As much as 27 inches was reported in western Kansas (Mount Sunflower), giving the current state record a run for its money. The corridor of heaviest snow extended into Colorado and remained for over a week (Figure 1). The 21-inch report from Sharon Springs tied for the 7th highest one-day snowfall on record for Kansas. This storm system was well forecasted but over-performed, with many totals as much as quadruple the anticipated snow amount. This article will briefly explain what happened, discuss Kansas snow records, and how you can make history with an accurate snow report.
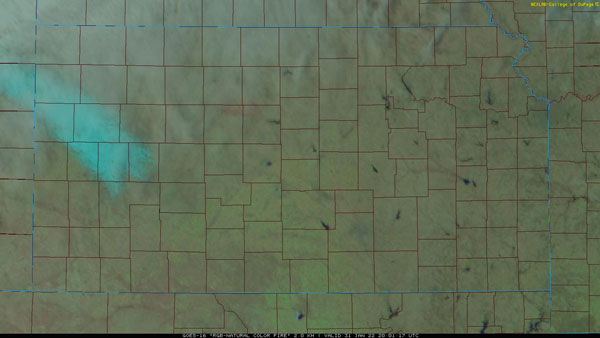
Figure 1. Lingering snow a week (January 31st) after the event as observed by satellite imagery. Snow highlighted in blue. Source: College of DuPage.
A little science behind the meteorology
Snow is a complicated event to forecast. It can get “buried” in technical concepts including physics, buoyancy, dendritic growth zones, snow-to-liquid ratios, conditional symmetric instability and more. For now, let’s discuss one component, snow-to-liquid ratios or SLR. On average, snow typically is a 10:1 SLR, meaning one inch of moisture for every ten inches of snow. In a warm, near-freezing (32F) environment, this can be as low as 5:1 and results in extremely heavy, wet snow. Great snowman making but dangerous to shovel. However, in a very cold environment (both at the surface and above), these ratios can exceed 30:1. This snow is very dry, fluffy, and prone to blowing. For the event on January 25, there was a saturated atmosphere completely filled with moisture, ideal for heavy snow. Factor in the very cold temperatures and the atmosphere was primed to dump from 20-30:1 SLR in western Kansas.
Those cold temperatures and very moist air (saturated) are perfect to develop large dendrites, i.e. snow crystals (Figure 2). These dendrites have large amounts of open space around them. However, they accumulate fast and optimize the stacking ability of the snow - adding up quickly and efficiently on the ground. This is critical for large snow accumulations such as what occurred with this event.
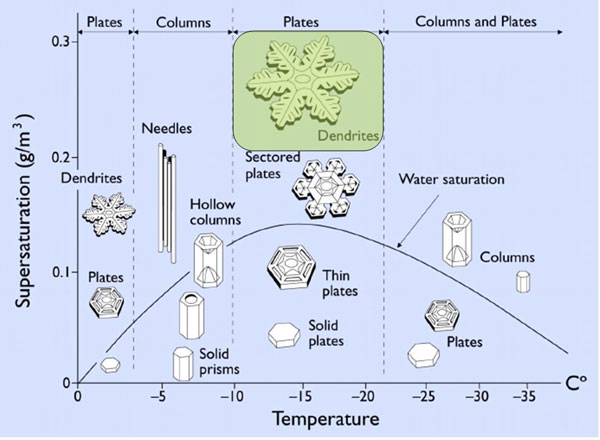
Figure 2. Snow crystal type by a function of temperature and supersaturation in the snow development layer (cloud). Source: Libbrecht, 2012.
Snow totals and the current state record(s)
As a result of these atmospheric conditions, snow totals were impressive for this event. Along and south of the Smoky River valley, a band of totals of 15+ inches extended from Burlington to Scott City (Figure 3). The largest totals observed were 27 inches at Mount Sunflower, 22 inches in east Scott County, and Sharon Springs with 21.8 inches. These large totals were all in a 24-hour time frame on January 25 and had many people questioning the current state records.
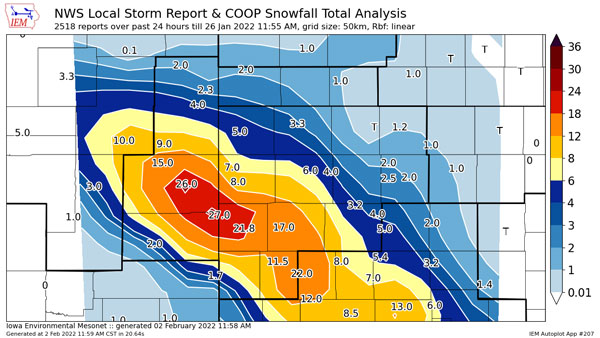
Figure 3. Public and COOP snow reports to the National Weather Service ending on January 26, 2022. Note, some totals are unofficial. Source: IEM.
As of this writing, the record highest daily total in Kansas occurred on March 28, 2009. Two locations in Pratt County reported 30 inches from that storm, upsetting the previous record of 25 inches set in 1903 (Table 1). Only seven storms have ever resulted in a 20+ inches total amount over a 24-hour period. Some storms do persist longer than just a day. When considering storm totals over a 3-day period, there are forty reports that exceed 20 inches with 13 at/above 25 inches (Table 2). However, many of the same events are included in the 3-day summary as the single day totals. Only 10 years in the last 137 have had a 20+ inches report, a 7% chance for any one year. Quite a rare event!
Table 1. Maximum one day snowfall reports over 20” on record at official observing locations. The Sharon Springs total from January 25, 2022 is highlighted in blue - the only 20”+ valid observation to be stored in the historical record. Source: ACIS.
|
Maximum 1-Day Snowfall Over 20" |
|||
|
Station |
Type |
Amount (Inches) |
Date |
|
Pratt 3NW |
NWS COOP |
30 |
3/28/2009 |
|
Preston 3.2 WNW |
CoCoRaHS |
30 |
3/28/2009 |
|
Ulysses 3NE |
NWS COOP |
25 |
2/26/1903 |
|
Wamego 4 W |
NWS COOP |
24 |
2/27/1900 |
|
Norcatur 3WSW |
NWS COOP |
24 |
10/26/1997 |
|
Elkhart |
NWS COOP |
23 |
5/1/2017 |
|
Syracuse 1NE |
NWS COOP |
22 |
5/1/2017 |
|
Atwood |
NWS COOP |
22 |
11/18/2015 |
|
Tribune 13NNE |
NWS COOP |
22 |
12/30/2006 |
|
Lenora COOP |
NWS COOP |
21.5 |
10/26/1997 |
|
Sharon Springs |
NWS COOP |
21 |
1/26/2022 |
|
Arlington |
NWS COOP |
21 |
3/27/2009 |
Table 2. Maximum 3-day snowfall reports over 25” on record at official observing locations. Source: ACIS.
|
Maximum 3-Day Snowfall Over 25" |
|||
|
Station |
Type |
Amount (Inches) |
Date |
|
Elkhart |
NWS COOP |
33 |
2/26/1903 |
|
Wallace |
NWS COOP |
31.5 |
12/31/2006 |
|
Hugoton |
NWS COOP |
31.4 |
12/20/1918 |
|
Sharon Springs |
NWS COOP |
31 |
12/31/2006 |
|
Pratt 3NW |
NWS COOP |
30 |
3/30/2009 |
|
Preston 3.2 WNW |
CoCoRaHS |
30 |
3/30/2009 |
|
Syracuse 7.2 WSW |
CoCoRaHS |
27 |
5/1/2017 |
|
Leoti |
NWS COOP |
26 |
1/1/2007 |
|
Atchinson |
NWS COOP |
25.8 |
4/2/1926 |
|
Johnson |
NWS COOP |
25.5 |
5/1/2017 |
|
Traer 2.5 NNW |
CoCoRaHS |
25.2 |
12/31/2006 |
|
Ulysses 3NE |
NWS COOP |
25 |
2/28/1903 |
|
Syracuse 1NE |
NWS COOP |
25 |
5/1/2017 |
You can make history!
A photo of a 27-inch snowfall was making its rounds on social media following the snow storm on January 25 (Figure 4). This is very cool photo of an impressive snowfall event! If you are interested in official documentation, there are a few requirements involved when measuring snowfall amounts for historical records.
- To properly measure snow, you must measure on the ground. This ensures accurate and consistent measurements, even if some snow melts on contact. Elevated surfaces like the table/bench pictured freeze before the ground and will hold snow sooner. Therefore, it won’t match historical data.
- Snow should be measured on a snow board. This is a white piece of wood or water board that is at least ¾” inch thick and painted white.
- Observations should be taken in an open area that is not prone to drifting, nor subject to obstructions. Although wind was light, there are trees in close proximity to the location. This implies unnatural impacts to the measurements made and potential inconsistencies.
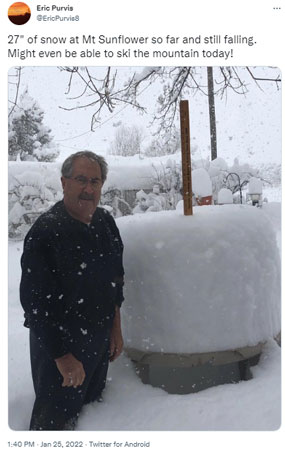
Figure 4. Tweet from Eric Purvis featuring Ed Harold, property owner. Source: https://twitter.com/EricPurvis8/status/1486093840670887936
Lastly, you have to be a registered weather observer. This ensures you are trained and can properly take consistent observations. This may sound daunting; however, joining/training is free! The Community Collaborative Rain Hail and Snow network, or CoCoRaHS for short, is a citizen science driven project that obtains 10,000+ observations a day. Everyone uses the same rain gauge (see Figure 5) and consistently reports. Had the Mount Sunflower observation been an official CoCoRaHS report, it would go down in history. Until we increase the number of reporters in many of these low observation areas, we will never quite know what goes on.
Let’s make history! Join CoCoRaHS today: https://www.cocorahs.org/
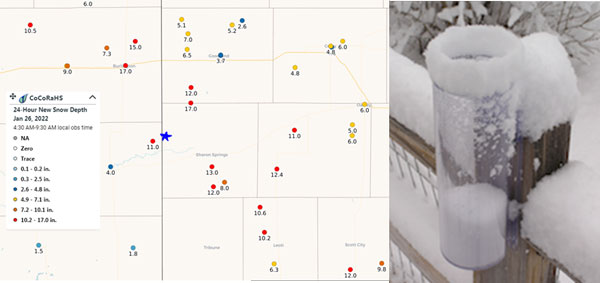
Figure 5. On the left is a map of the Community Collaborative Rain Hail and Snow (CoCoRaHS ) network snow measurements on the morning of January 26, 2022. The blue star represents the approximate location of Mount Sunflower. On the right is a CoCoRaHS standardized rain gauge of which all these reporters use. Source: CoCoRaHS.
Sources:
CoCoRaHS rain gauge: https://weatheryourway.com/collections/cocorahs-gauge-parts/products/official-cocorahs-gauge
Libbrecht, Kenneth. (2012). Toward a Comprehensive Model of Snow Crystal Growth Dynamics: 1. Overarching Features and Physical Origins.
Chip Redmond, Kansas Mesonet
christopherredmond@ksu.edu
Tags: winter weather snow CoCoRaHS