The official first day of winter is still a couple days away and cold temperatures are returning! However, it is not always the temperature that gives the air that bite. The “feels like” temperature is usually influenced by the wind as well. We call this the wind chill. Factoring in the wind chill is particularly important in Kansas as the wind is often blowing.
What is the wind chill?
When temperatures drop below 50°F and wind speeds are greater than 5 mph, the “feels Like” temperature is lower than the actual temperature. Wind chill can be calculated two ways: 1) using the chart below, or 2) mathematically. As the wind increases and/or the temperature decreases, wind chill values decrease. This means that despite it being 0°F on a very cold morning, when factoring in the wind (for example 20 mph), it can feel like a much colder temperature (in this example, -22°F).
This colder “feels like” temperature can not only make you feel chilled quicker; it can also lead to other problems such as frostbite much quicker. Exposure time estimations of frostbite issues at 0°F with no wind is 30 minutes, while 0°F and 55mph winds is less than 10 minutes of exposure. Wind chills can be determined by the following chart from the National Weather Service (https://www.weather.gov/safety/cold-wind-chill-chart):
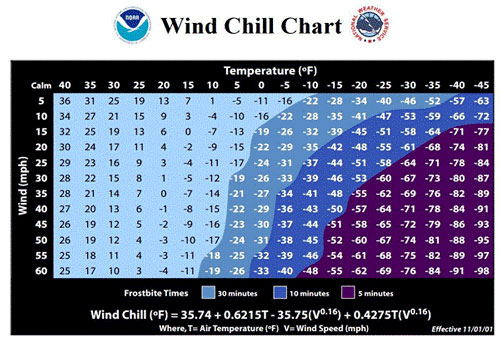
Figure 1. Wind chill chart from the National Weather Service.
Where can you access wind chill data?
The Kansas Mesonet makes viewing the wind chill very easy! We have put together a webpage that displays a gradient map that depicts the current wind chill at:
http://mesonet.k-state.edu/weather/windchill/
It is also accessible by clicking the banner on the Kansas Mesonet homepage, mesonet.ksu.edu. The map defaults to the current wind chill, but also has a selection at the top where you can change the map to view temperature and wind speed/direction. Since these are the two ingredients for the wind chill, it tells the complete story. The table below the map also displays the wind chill, temperature, and wind data for each station in sortable columns. By clicking the column headings, that particular column will sort from lowest to highest values. Click it again and it will reverse. You can also select a specific station either on the map or in the data table and it will display the specific information for that location.
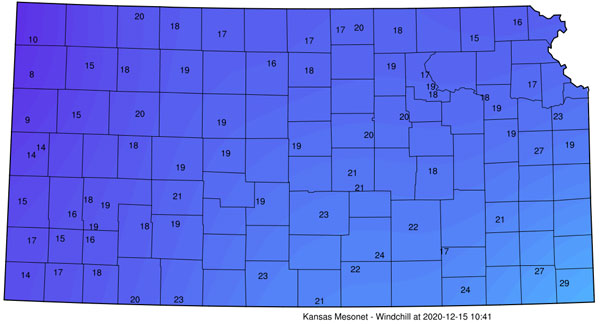
Figure 2. Map of wind chills as of 12/15/2020 at 10:41 a.m.
How many hours has the temperature been below freezing?
Winter wheat and cover crop producers still have an interest in the cold temperatures. The freeze monitor data is available on our webpage. It allows you to track the hours below 32°F or those below 24°F. You can access it through the menu in the top left (Weather àFreeze Monitor) or at: mesonet.ksu.edu/weather/freeze
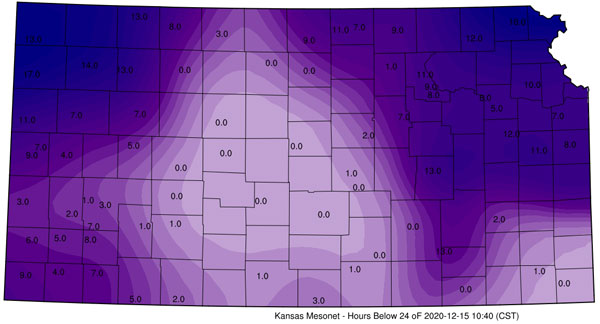
Figure 3. Hours below 24°F as of 11:47 am on 12/15/2020.
Stay warm and safe on these cold days! Winter is just beginning…
Christopher “Chip” Redmond, Kansas Mesonet Manager
christopherredmond@ksu.edu
Mary Knapp, Assistant Climatologist
mknapp@ksu.edu
Dan Regier, Weather Data Library Developer
regierdp@ksu.edu
Tags: weather wind chill Mesonet