The winter of 2020-2021 was not as harsh as some winters, but there were still conditions that resulted in negative impacts on cattle, particularly calves. One indication of the winter weather impacts was the number of requests for Mesonet data to document losses under the Livestock Indemnity Program. Aside from winter stress, monitoring summer stress is also important to ensure healthy livestock.
While cold and wet conditions are often the focus in the winter months, the summer stresses are focused more on temperature, humidity and solar impacts. Obviously these take additional proactive steps to reduce potential exposure than the cold impacts. Actual animal response to temperature stress will be dependent on a number of factors not accounted for in the index. Those include, but are not limited to: age, hair coat (winter vs summer; wet vs dry), health, body condition, micro-environment, and acclimatization. However, despite some of these unknowns, producers can evaluate the environmental conditions to livestock using the Kansas Mesonet Animal Comfort tool.
Users can access this tool from either the main Mesonet page by selecting from the drop down menu, Agriculture, and then Comfort Index (Figure 1); or directly from this link: http://mesonet.k-state.edu/agriculture/animal/

Figure 1. Screenshot of the menu path to the Animal Comfort Index page on the Kansas Mesonet.
Understanding the Comfort Index
Building on the Comprehensive Comfort Index produced at University of Nebraska, this tool illustrates the impact of both extremes of hot and cold. The index is unique in that it includes, in addition to air temperature and relative humidity, effects of wind speed and solar radiation. Development and validation of the index used data from beef and dairy cattle. The map indicates where current conditions fit on the scale.
Using the “Resources” tab on the webpage, users can learn more about the index, scale and resulting potential impact (Figure 2). This also describes the colors used on the map and chart. In addition, users can examine the Nebraska publication if they would like to review the actual calculations.

Figure 2. Cattle comfort ranges. Graphic from Kansas Mesonet.
Tracking conditions
A particularly useful resource is the 7-day graph found under the “Chart” tab. This allows producers to monitor how conditions have fluctuated over the past week (Figure 3). Daily peaks can be expected each afternoon when temperatures are the warmest with peak solar radiation. Values then fall during the, usually cooler, overnight. Since stress impacts can be cumulative, having this feature allows producers to evaluate management requirements. This is especially a concern during warm overnights when values don’t drop below higher stress levels.
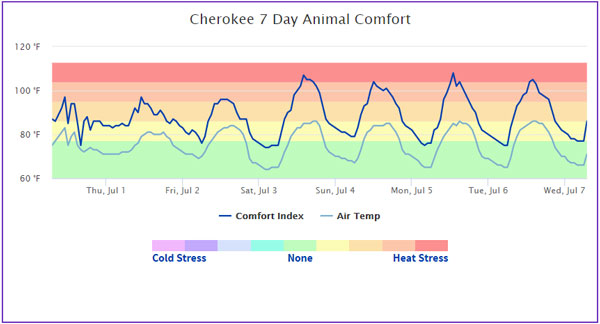
Figure 3. Animal Comfort index history at Cherokee County Mesonet station, near Columbus, KS. Graphic from Kansas Mesonet.

Figure 4. Cattle on a pasture near the Woodson Mesonet station. Photo by Chip Redmond, K-State Research and Extension.
Christopher “Chip” Redmond, Kansas Mesonet Manager
christopherredmond@ksu.edu
Mary Knapp, Weather Data Library
mknapp@ksu.edu
Tags: Mesonet livestock high temperatures Cattle Comfort Tool