The optimum seeding rate is one of the most influential factors for increasing soybean profitability as seed cost is one of the most expensive inputs. Soybean seeding rate, row spacing, and planting date are all tied together. The final number of seeds per linear foot of row decreases as row spacing narrows. For example, at a target population of 105,000 plants per acre and 85 percent germination, 30-inch rows will need twice the number of seeds per linear foot as 15-inch rows (6 vs. 3 seeds per linear foot). Seeding rate will need to increase at later planting dates to compensate for the reduction in the growing season since more plants are needed to increase early light interception and biomass production.
Seeding rates for high-yielding soybeans: A case study
Information gathered from the Kansas Soybean Yield contest shows that maximum yield (more than 90 bushels per acre) could be achieved with seeding rate ranging from 120,000 to 180,000 seeds per acre (Fig. 1). Note: most of the yields ranged from 60 to 90 bushels per acre.
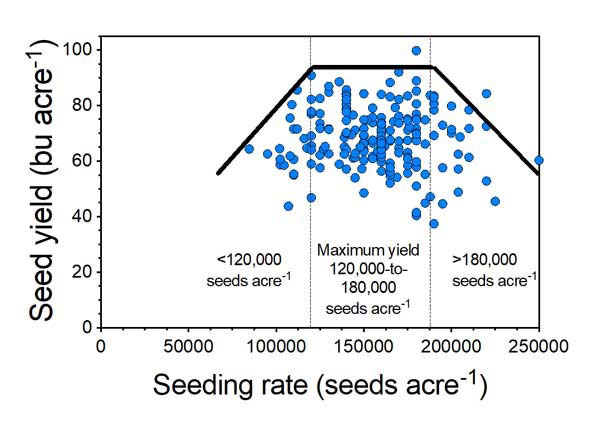
Figure 1. Relationship of soybean yield versus seeding rate for Kansas Soybean Yield Contest data. Graph by Ignacio Ciampitti, K-State Research and Extension.
Yield potential for each environment should be consider when deciding soybean seeding rates. Yield potential is primarily defined by weather conditions (before and after planting), genetic potential, soil type, fertility program, and use of best management practices for producing the crop (proper weed, insect, and disease control from planting until harvest). Before deciding the seeding rates, it is necessary to consider potential soil and weather conditions that could affect the success of the final stand establishment, to achieve the proper plant density required for each yield environment (YE).
Summary of a recent plant density study
Recent economic and productive circumstances have caused interest in within-field variation of the agronomic optimal plant density (minimum number of plants in a per-unit-area basis required to maximize yield) for soybean. A recent study by Carciochi, Ciampitti and collaborators from Corteva published in Agronomy Journal presented a new insight about the optimal plant density by yield environment. For that study, a soybean database evaluating seeding rates ranging from 69,000 to 271,000 seeds per acre was collected, including final number of plants and seed yield. The data was classified in yield environments: low (LYE, <59.6 bu per acre), medium (MYE, 59.6-64.1 bu per acre), and high (HYE, >64.1 bu per acre).
The main outcomes from this study were:
- Optimum plant density decreased by 24% from low (127,000 plants per acre) to high (97,000 plants per acre) yield environments (Fig. 2).
- Optimal density (50% interquantile) ranged between 109,000 - 144,000 plants per acre for the low, from 77,000 to 114,000 plants per acre for the medium, and 76,000 to 117,000 plants per acre for the high yield environment (Fig. 3).
- Greater optimal density for the low yield was not related to a low plant survival rate.
- Less precipitation during the reproductive period was one of the main causes for the need to increase the plant density in low yield environments to overcome a possible reduction in the crop reproductive ability.
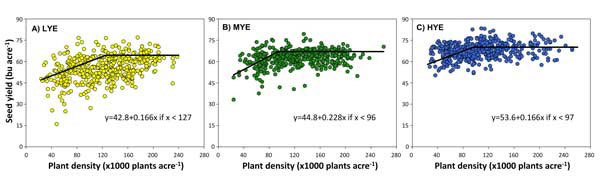
Figure 2. Relationship between seed yield and plant density for low (LYE, <59.6 bushels per acre, A), medium (MYE, 59.6-64.1 bushels per acre, B), and high yield environments (HYE, >64.1 bushels per acre, C). Models were fitted using hierarchical Bayesian models. Graphs by Ignacio Ciampitti, K-State Research and Extension.
This is valuable information for site-specific management strategies, such as variable seeding rate. Thus, within a field, yield variation could be better related to the adjustment of seeding rate for soybeans, improving both the productivity and net return for farmers.
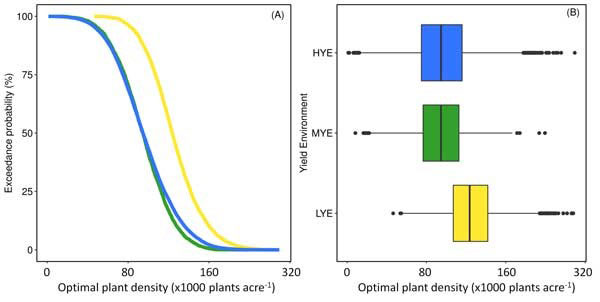
Figure 3. Cumulative probabilities (%) of agronomic optimal plant density (AOPD, plants per acre) (A) and AOPD range to achieve the maximum yield for the seed yield-to-plant density relationship for the low (LYE, in yellow), medium (MYE, in green), and high yield environment (HYE, in blue) (B). For panel B, box plots portray the 25th (bottom edge of the box) and the 75th (top edge of the box). The solid line within the box represents the median and the circles referred to outliers.
In summary, adjusting seeding rates reduces risks of yield losses due to suboptimal densities in a low yield environment, while limiting higher seed costs due to supra-optimal densities, especially for medium and high yield environments. Moreover, soybean plant density levels above the optimal plant density increase the risk of lodging and disease development without adding a yield benefit.
For more information about the optimal soybean seeding rates and optimal plant densities, please consult this new publication from KSRE prepared by Drs. Ciampitti, Carciochi, and Schwalbert:
https://bookstore.ksre.ksu.edu/pubs/MF3460.pdf
Ignacio Ciampitti, Farming Systems
ciampitti@ksu.edu