Plant analysis is an excellent in-season “quality control” tool. It can be especially valuable for managing secondary and micronutrients that do not have high-quality, reliable soil tests available, and for providing insight into how efficiently you are using applied nutrients.
Plant analysis can be used by Kansas farmers in two basic ways: for diagnostic purposes, and for monitoring nutrient levels at a common growth stage. Diagnostics can be done any time and is especially valuable early in the season when corrective actions can easily be taken. Monitoring is generally done at the beginning of reproductive growth.
General sampling guidelines:
- Plants are less than 12 inches tall: Collect the whole plant; cut the plant off at ground level.
- Plants more than 12 inches tall and until reproductive growth begins: Collect the top fully developed leaves (those which show leaf collars).
- After reproductive growth starts: Collect the ear leaves (below the uppermost developing ear), samples should be collected at random from the field at silk emergence.
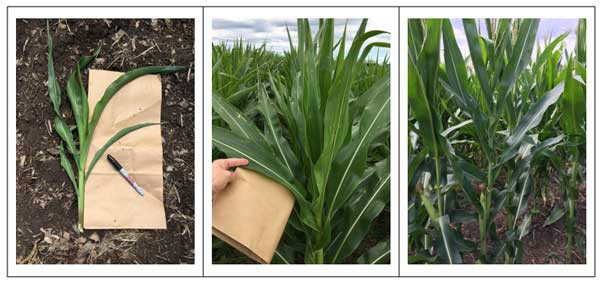
Figure 1. Corn sampling during different growth stage. Photos by Dorivar Ruiz Diaz, K-State Research and Extension.
Plant analysis for diagnostic sampling
When sampling for diagnostic purposes, collecting specific plant parts is less important than obtaining comparison samples from good and bad areas of the field.
Plant analysis is an excellent diagnostic tool to help understand some of the variation among corn plants in the field. When using plant analysis to diagnose field problems, try to take comparison samples from both good/normal areas of the field, and problem spots. This can be done at any growth stage.
Along with taking plant tissue samples, it is also helpful to collect a soil sample from both good and bad areas when doing diagnostics. Define your areas, and collect both soil and plant tissue from areas that represent good and bad areas of plant growth. Soil samples can help define why a problem may be occurring. The soil sample may find certain nutrient levels are very low in the soil, helping to explain why a deficiency is occurring. However, other factors can also cause nutrient problems. Soil compaction, or saturation of soils for example, often limits the uptake of nutrients, especially potassium, which are otherwise present in adequate amounts in the soil.
Plant analysis for nutrient monitoring
For general monitoring or quality control purposes, plant leaves should be collected as the plant enters reproductive growth. Sampling under stress conditions for monitoring purposes can give misleading results, and is not recommended. Stresses such as drought or saturated soils will generally limit nutrient uptake, and result in a general reduction in nutrient content in the plant.
How should you handle samples and where should you send the samples?
The collected leaves should be allowed to wilt over night to remove excess moisture, placed in a paper bag or mailing envelope, and shipped to a lab for analysis. Do not place the leaves in a plastic bag or other tightly sealed container, as the leaves will begin to rot and decompose during transport, and the sample won’t be usable. Most of the soil testing labs working in the region provide plant analysis services, including the K-State Testing Lab. For questions about the plant tissue testing services at the K-State Testing Lab, email soiltesting@ksu.edu or call 785-532-7897.
What nutrients should be included in the plant analysis?
In Kansas, nitrogen (N), phosphorus (P), potassium (K), sulfur (S), zinc (Zn), chloride (Cl), and iron (Fe) are the nutrients most likely to be found deficient. Recently, questions have been raised concerning copper (Cu), manganese (Mn), and molybdenum (Mo), though widespread deficiencies of those micronutrients have not been found in the state. Normally the best values are the “bundles” or “packages” of tests offered through many of the labs. They can be as simple as N, P and K, or can be all the mineral elements considered essential to plants. K-State offers a package which includes N, P, K, Ca, Mg, S, Fe, Cu, Zn, and Mn.
What will you get back from the lab?
The data returned from the lab will be reported as the concentration of nutrient elements, or potentially toxic elements, in the plants. Units reported will normally be in “percent” for the primary and secondary nutrients (N, P, K, Ca, Mg, S, and Cl) and “ppm” (parts per million) for most of the micronutrients (Zn, Cu, Fe, Mn, B, Mo, and Al).
Most labs/agronomists compare plant nutrient concentrations to published sufficiency ranges. A sufficiency range is simply the range of concentrations normally found in healthy, productive plants during surveys. It can be thought of as the range of values optimum for plant growth. The medical profession uses a similar range of normal values to evaluate blood work. The sufficiency ranges change with plant age (generally being higher in young plants), vary between plant parts, and can differ between hybrids. A value slightly below the sufficiency range does not always mean the plant is deficient in that nutrient. It is an indication that the nutrient is relatively low. Values on the low end of the range are common in extremely high-yielding crops. However, if that nutrient is significantly below the sufficiency range, you should ask some serious questions about the availability and supply of that nutrient.
Keep in mind that any plant stress (drought, heat, soil compaction, saturated soils, etc.) can have a serious impact on nutrient uptake and plant tissue nutrient concentrations. A low value of a nutrient in the plant does not always mean the nutrient is low in the soil and the plant will respond to fertilizer. It may be that the nutrient is present in adequate amounts in the soil, but is either not available or not being taken up by the plant for a variety of reasons. Two examples are drought, which can reduce plant uptake of nutrients and cause low nutrient values in the plant, and high-pH soils, which can cause low iron availability.
On the other extreme, levels above “sufficiency” can also indicate problems. High values might indicate over-fertilization and luxury consumption of nutrients. Plants will also sometimes try to compensate for a shortage of one nutrient by loading up on another. This occurs at times with nutrients such as iron, zinc, and manganese.
Table 1 gives the range of nutrient contents considered to be “normal” or “sufficient” for corn seedlings below 12 inches tall and for the ear leaf of corn at silking. Keep in mind that these are the ranges normally found in healthy, productive crops.
Table 1. Range of nutrient contents considered “normal” or “sufficient” at two growth stages in corn.
|
Nutrient |
Unit |
Whole Plant <12” tall |
Corn Ear Leaf at Green Silk |
|
Nitrogen (N) |
% |
3.5-5.0 |
2.75-3.50 |
|
Phosphorus (P) |
% |
0.3-0.5 |
0.25-0.45 |
|
Potassium (K) |
% |
2.5-4.0 |
1.75-2.25 |
|
Calcium (Ca) |
% |
0.3-0.7 |
0.25-0.50 |
|
Magnesium (Mg) |
% |
0.15-0.45 |
0.16-0.60 |
|
Sulfur (S) |
% |
0.20-0.50 |
0.15-0.50 |
|
Chloride (Cl) |
% |
Not established |
0.18-0.60 |
|
Copper (Cu) |
ppm |
5-20 |
5-25 |
|
Iron (Fe) |
ppm |
50-250 |
20-200 |
|
Manganese (Mn) |
ppm |
20-150 |
20-150 |
|
Zinc (Zn) |
ppm |
20-60 |
15-70 |
|
Boron (B) |
ppm |
5-25 |
4-25 |
|
Molybdenum (Mo) |
ppm |
0.1-10 |
0.1-3.0 |
|
Aluminum (Al) |
ppm |
<400 |
<200 |
Summary
In summary, plant analysis is a good tool to monitor the effectiveness of your fertilizer and lime program and as a very effective diagnostic tool. Consider adding this to your toolbox.
Dorivar Ruiz Diaz, Nutrient Management Specialist
ruizdiaz@ksu.edu