Winter wheat is beginning to break dormancy and the Kansas Mesonet has introduced a new tool to help track the crop development. The Wheat Growth Stage page tracks wheat growing degree days (GDD), which are highly correlated with wheat growth stage. This tool employs a wheat growth model developed by Kansas State University based on field observations collected throughout the state between 2015-2019. The output of the model provides an estimate of the current (and historical) growth stage of the crop in Kansas.
Wheat growth stages
There are multiple scales used to describe wheat growth. Perhaps the most common example used by Kansas farmers is the Feekes growth stage scale, which was developed in the 1950’s (Figure 1). This scale describes wheat development with respect to visual characteristics of the plants and assigns a numerical code to facilitate note taking and communication among growers. This growth stage information is often incorporated into wheat management decisions regarding fertilizer and pesticide application timing. In fact, many product labels contain specific application guidelines and/or restrictions based on wheat growth stage. Knowledge of the crop’s growth stage also allows the ability to gauge for potential impacts of environmental events such as spring freeze.

Figure 1. Feekes scale of wheat development provides a visual representation, text description of wheat growth, and assigns a numerical value to each category. (https://bookstore.ksre.ksu.edu/pubs/MF3300.pdf).
Calculation of wheat GDD and estimated growth stages
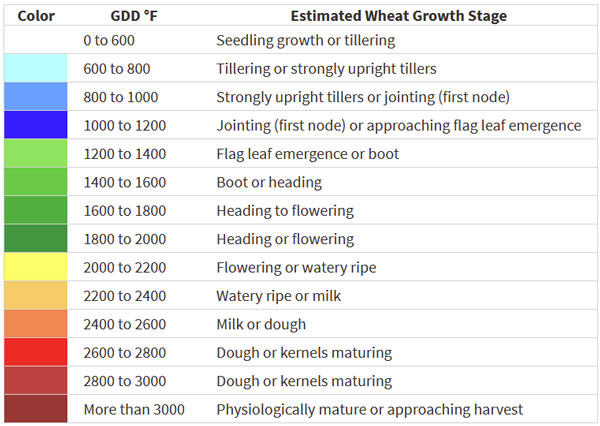
Wheat growth stage is estimated for each location-year based on a simple empirical estimate of growing degree days (Equation 1) accumulation since January 1st. The wheat growth model deployed here translates the GDD into general categories of wheat growth (Figure 2). These general categories help the model account for differences in crop development among different fields due to contrasting wheat varieties or sowing dates, which are not integrated directly into the wheat growth model.
Accumulated GDD were calculated based on Equation 1:

where Tmax and Tmin are maximum and minimum daily temperatures (°C) for day of year, and Tbase is the crop’s base temperature which was assumed to be a constant 0°C (McMaster & Wilhelm, 1997).

Figure 2. The wheat growth stage model translates growing degree days (GDD) values into general categories of wheat development. Note: a general category is provided to help account for differences in growth that often result for different sowing dates and cultivar maturities.
How might you benefit from the Kansas Mesonet Wheat GDD page?
Here are a few examples:
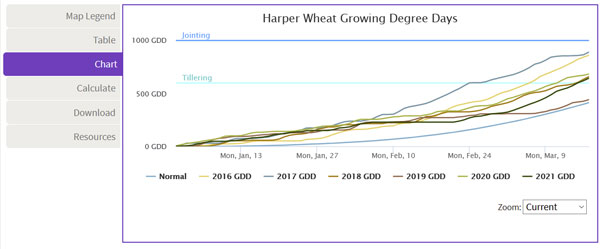
- Compare previous years with a chart. Select the “Chart” tab within the wheat growth tools (Figure 3). By selecting specific years of interest, it is possible to compare the current year to other recent years and the long-term normal for a given location. Current data supports comparisons between 2016-present year. The example below illustrates a comparison made for Harper KS. Note how the years of 2017 and 2019 were contrasting (warmer vs. cooler), which directly impacts crop development.

Figure 3. Screenshot of the “Chart” feature using the Wheat GDD tool.
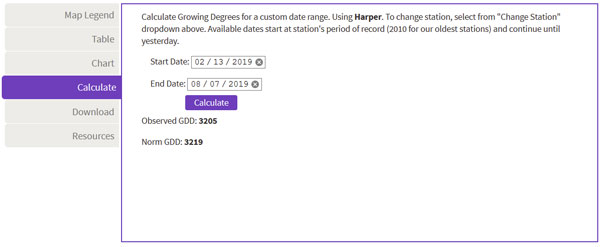
- Calculate historical GDD values for a given date or range of dates. Select the “Calculate” tab and specify a date range of interest (Figure 4). This tool allows specific comparisons of the observed GDD from the current growing season and historical normal within a given timeframe.

Figure 4. Screenshot of the "Calculate" feature using the Wheat GDD tool.
- Statewide statistics: The table lets you quickly view and sort data from across the state. You can also download data to perform your own analysis (see the Download tab).
- Graphics and social media: Download any of the maps in .PNG format for easy sharing.
Chip Redmond, Mesonet Manager
christopherredmond@ksu.edu
Mary Knapp, Assistant State Climatologist
mknapp@ksu.edu
Erick DeWolf, Wheat Pathologist
dewolf1@ksu.edu
Romulo Lollato, Wheat and Forages Specialist
lollato@ksu.edu
Tags: wheat Mesonet GDD tool growing degree days