The National Sorghum Yield Contest embraces four objectives:
- Improve sorghum yields across the country,
- Transfer knowledge between growers,
- Identify top sorghum producers in each state,
- Recognize growers for their outstanding yields.
This article contains information from the KSRE publication MF3615 National Sorghum Yield Contest: A Summary for Kansas. The full publication is available online at: https://bookstore.ksre.ksu.edu/pubs/MF3615.pdf
Results
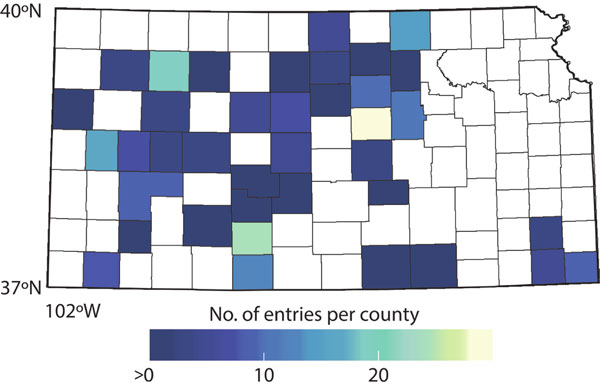
Five years of data were summarized (2013-2017) from the National Sorghum Yield Contest with a focus on Kansas entries. The data analyzed comprised a total of 175 observations from 38 counties (Figure 1). Most entries were for dryland fields (63%) with an average yield of 139 bushels per acre. For irrigated fields, the average water application was 8 inches, with a yield of 161 bushels per acre. Data entries were split in three groups (high, medium, and low) according to their yield values.
- The high-yielding group included values from 175 to 230 bushels per acre, with an average of 190 bushels per acre (n=32),
- The medium-yielding group included values from 125 to 175 bushels per acre, with an average value of 150 bushels per acre (n=101), and
- The low-yielding values ranged from 60 to 125 bushels per acre, with an average yield of 110 bushels per acre (n=42).

Figure 1. Number of entries per county for the National Sorghum Contest between 2013 and 2017 for the state of Kansas.
Grain yield reported by the National Agricultural Statistics Service from USDA for the sorghum yield from the same period (2013-2017) ranged from 59 to 91 bushels per acre. Thus, the data from the yield contest is roughly two-fold above the state average.
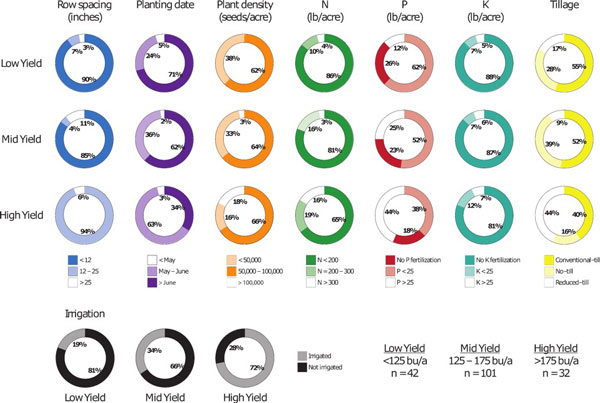
Conventional tillage presented similar frequencies across yield groups (Figure 2). The high-yielding group presented a large proportion of fields with reduced-till; yet this factor was not significant to explain the yield variations. Irrigated fields prevailed in the high-yielding group (72%; Figure 2), diminishing their frequency within the medium- and low-yielding groups (34 and 19%, respectively).
Crop Management
Management practices explained close to 80% of the yield variation. Irrigation was the factor accounting for a large proportion of the yield variation (21%), followed by nitrogen fertilization (18%), and changes in planting date (11%). Row spacing did not vary among yield groups (Figure 2). Most entries (88%) presented a row spacing of 30 inches. The remaining 12% had other variations with narrower rows (10 to 20 inches). No significant yield differences were observed relating to row spacing. High-yielding planting dates ranged from May 1 to June 1. A greater proportion of late-planting dates (after June 1) were found in medium- to low-yielding groups (Figure 2). No distinctive pattern was found regarding plant density among yield groups (Figure 2). Irrigated fields had higher seeding rates. Observations with nitrogen fertilization of less than 200 pounds per acre were the most frequent (n=126). These low nitrogen fertilization rates were less frequent in the high-yielding group (Figure 2), with the high-yielding group presenting a high frequency of high phosphorus rates (P>25 pounds per acre) and lowest proportion of no phosphorus fertilization (Figure 2).

Figure 2. Summary of crop management practices for the different yield groups. The high-yielding group ranged from 175 to 230 bushels per acre (n=32), medium-yielding group ranged from 175 and 125 bushels per acre (n=101), and low-yielding group ranged from 60 to 125 bushels per acre (n=42).
Summary
The reported management practices implemented by farmers in the five years (2013-2017) analyzed from the National Sorghum Yield Contest impacted the sorghum yields in different magnitudes. The result of the study indicated that the use of irrigation and adequate nitrogen fertilization is critical to maximize sorghum grain yields in Kansas. In addition, planting before June was shown to be a relevant strategy to maximize sorghum yields across the different production regions.
Ana Carcedo, Postdoctoral Research Fellow – Ciampitti Lab
carcedo@ksu.edu
Ignacio Ciampitti, Farming Systems
ciampitti@ksu.edu
Tags: sorghum grain sorghum publication yield estimates Sorghum Yield Contest