Corn flowering
With most corn fields in Kansas already on reproductive stages (or close to flowering for late-planted fields), it is time to start assessing grain yield potential. Successful pollination is a critical aspect that farmers can evaluate by examining ear silks. Having conditions that favor the synchrony between the pollen shed by the tassels and the silks, the exposed silks should be turning brown and should easily separate from the ear when the husks are removed.
Water stress around flowering time (R1, http://www.bookstore.ksre.ksu.edu/pubs/MF3305.pdf) will negatively impact pollination due to a lack of synchrony between the pollen release and the emergence of the silks, which is a process that requires a lot of water. Heat stress around flowering will mainly impact the viability of the pollen. Normally, under dryland conditions in Kansas, water and heat stress use to happen together. Silks that have not been successfully pollinated will stay green, possibly growing several inches in length (Figure 1). Unpollinated silks also will be connected securely to the ovaries (the undeveloped kernels) when the husks are removed.

Figure 1. Long silks primarily reflecting floral asynchrony. Silks that have not been successfully pollinated will stay green. Infographic by Ignacio Ciampitti, K-State Research and Extension.
Corn yield potential estimation
Once pollination is complete or near completion, farmers could begin to estimate corn yield potential. To obtain a reasonable estimate, corn should be at least in the milk stage (R3). Before the milk stage, since grain abortion is still possible under stress conditions (mainly due to drought and/or heat stresses), it is difficult to tell which kernels will develop and which ones will abort.
To estimate yields, we can use the yield component method (Figure 2). This approach uses a combination of known and projected yield components. It is “potential” yield because one of the critical yield components, kernel size, remains unknown until physiological maturity. Therefore, we can only make an estimate of predicted yield based on expected conditions during the grain filling period (e.g. favorable, average, or poor).
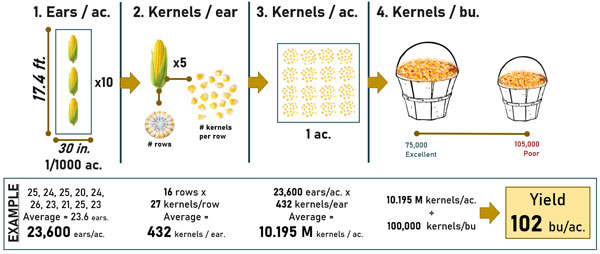
Figure 2. Example of corn yield estimation under the “yield components method”.
Estimating potential corn yield using yield components uses the following elements:
Step 1. Ears per acre: This is determined by counting the number of ears in a known area. With 30-inch rows, 17.4 feet of row = 1,000th of an acre. This is probably the minimum area that should be used. The number of ears in 17.4 feet of row x 1,000 = the number of ears per acre. Counting a longer length of row is fine, just be sure to convert it to the correct portion of an acre when determining the number of ears per acre. Make ear counts in 10 to 15 representative parts of the field or management zones to get a good average estimate. The more ear counts you make (assuming they accurately represent the field or zone of interest), the more confidence you have in the yield estimate.
Example (Figure 2, step 1):
- Counting 10 times 17.4-foot sections: (25 + 24 + 25 + 21 + 24 + 26 + 23 + 21 + 25 + 23)
- 236/10 = 23.6 ears. Scaling up to an acre: 23.6 x 1,000 = 23,600 ears per acre.
Step 2. Kernels per ear: There are two sub-components of kernels pear ear: (i) the number of rows per year, and (ii) the number of kernels within each row. Most likely, the number of rows will be around 16, and ears always keep and even number of rows. The number of kernels per row depends on multiple factors, starting from the hybrid, but it mainly depends on the growing conditions around flowering. To arrive at kernels per ear just multiply the two sub-components (number of rows x kernels per row). Note: do not count aborted kernels or the kernels on the butt of the ear; count only kernels that are in complete rings around the ear. Do this for every 5th or 6th plant in each of your ear count areas. Avoid odd, non-representative ears.
Example (Figure 2, step 2):
- Counting 5 ears from each 17.4-foot area had an average of 16 rows and 27 kernels per row: 16 x 27 = 432 kernels per ear
Step 3. Kernels per acre = Ears per acre x kernels per ear
Example (Figure 2, step 3):
- 23,600 ears per acre x 432 kernels per ear = 10,195,000 kernels per acre
Step 4. Kernels per bushel: This will have to be estimated until the plants reach physiological maturity. Common values range from 75,000 to 80,000 for excellent, 85,000 to 90,000 for average, and 95,000 to 105,000 for poor grain filling conditions. The best you can do at this point is estimate a range of potential yields depending on expectations for the rest of the season.
Example: Under a scenario of temperatures above 100° F for the next 7-14 days and lack of rains (and if these conditions persist), it might be more than reasonably to assume below-average grain filling conditions producing overall medium to small kernels. Based on the projected weather, a reasonable value might be 100,000 kernels per bushel (Figure 2, step 4).
Step 5. Bushels per acre:
- 10,195,000 kernels per acre ÷ 100,000 kernels per bushel ~ 102 bushels per acre
Final considerations
If these estimates are close to correct, the field in this example is probably worth taking to grain harvest. Past experience indicates that this method of estimating yield usually provides fairly optimistic estimates. Please consider these points when doing these field estimations during the current challenging conditions.
Ignacio Ciampitti, Farming Systems
ciampitti@ksu.edu
Adrian Correndo, Postdoctoral Fellow
correndo@ksu.edu