Soybeans acreage projections in Kansas are up 3% this season over the previous year (USDA prospective planting report). As seed cost is a critical economic factor, selecting the proper seeding rate is a key management practice. This article provides a summary of the main factors in determining soybean seeding rates.
- Seeding rate versus plant density
There are three important terms: (1) “Seeding rate” refers to the target number of planted seeds per acre. (2) “Plant population” or “plant density” refer to the effective number of plants growing in a field. (3) “Seed survival rate” refers to the percent seed germination and emergence Normally, we may expect that about 80% percent of the seeds planted will survive to become part of the final plant density. It’s best to start by knowing the final plant density you want, then using the expected survival rate to calculate back to the number of seeds per acre you’ll need to plant. Below is an example:

Example of seeding rate calculation with a plant density target of 100,000 plants/acre, and expected survival rate of 80% (0.8 plants/seed):

Note: The seed survival rate varies depending on specific environmental conditions and quality of the planting practice. Thus, before deciding the seeding rates, it is necessary to consider potential soil and weather conditions that could affect the success of the final stand establishment, to achieve the proper plant density required.
- Interaction with row spacing and planting date
Soybean seeding rate is tied to other practices such as row spacing and planting date. The final number of seeds per linear foot of row decreases as row spacing narrows. For example, at a target plant density of 105,000 plants per acre and 85 percent germination, 30-inch rows will have twice the number of seeds per linear foot as 15-inch rows (6 vs. 3 seeds per linear foot). However, the seeding rate per acre would remain the same for both row spacings, as only the number of seeds per linear foot would change, not the seeding rate per acre.
From a planting date standpoint, seeding rate will need to increase at later planting dates to compensate for the reduction in the length of the growing season and reduced potential for branches to contribute to yield.
- Adjusting by yield environment
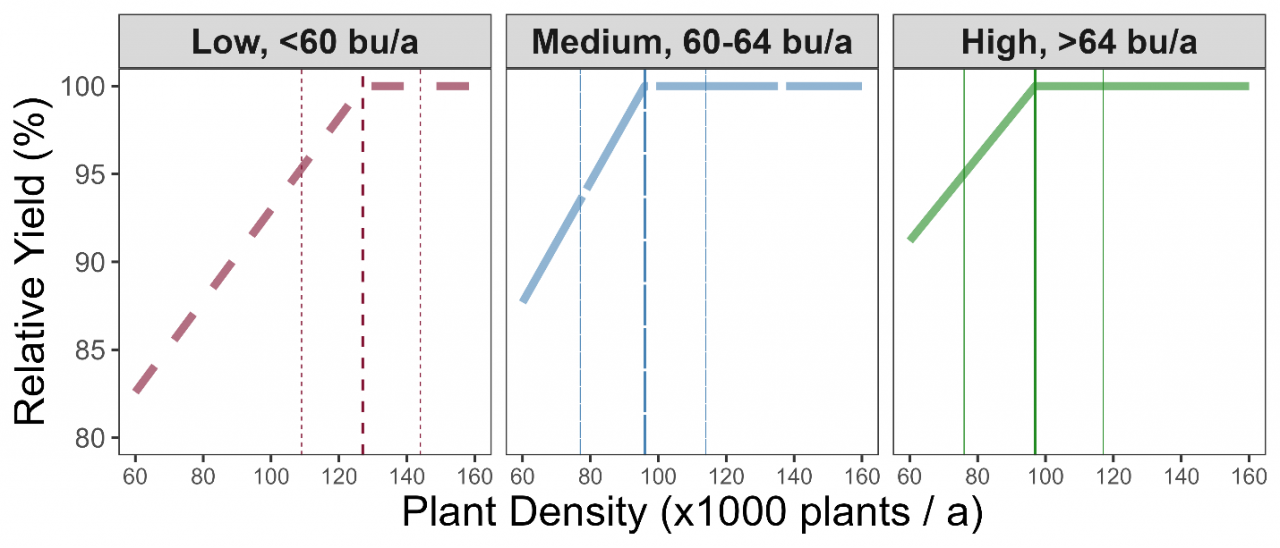
Identifying yield potential for each environment in your field is a good practice to use when refining the soybean seeding rate decision. A recent study by Carciochi, Ciampitti and collaborators published in Agronomy Journal evaluated soybean yield performance in a database of hundreds of experiments across the Midwest. Seeding rates ranged from 69,000 to 271,000 seeds/a, and final plant density and seed yield data were considered for the analysis. The data was classified by yield environments as follows: Low (<60 bu/a), Medium (60-64 bu/a), and High (>64 bu/a).

Figure 1. Expected soybean relative yield (%) with respect to the optimal plant density by yield environment. Vertical lines indicate expected optimal plant densities (Low: 127,000 plants/a; Medium: 96,000 plants/a; High: 97,000 plants/a) and their corresponding uncertainty (95% intervals). Adapted from Carciochi et al. (2018). (We’ll need to put this citation at the end of the article.)
The main outcomes from this study were:
- Most probable values. On average, optimum plant densities were:
- Low yield environments: 127,000 plants/a,
- Medium yield environments: 96,000 plants/a
- High yield environment: 97,000 plants/a.
- Expected uncertainty. In 50% of cases, optimum plant densities ranged from:
- Low yield environments: 109,000 - 144,000 plants/a
- Medium yield environments: 77,000 to 114,000 plants/a, and
- High yield environments: 76,000 to 117,000 plants/a.
- In low yield environments, the need for higher optimal plant density was not related to a low plant survival rate, but to a reduced potential growth rate per plant.
- Another reason for the need for higher plant density in low yield environments is that there is often less precipitation during the reproductive period in these environments, reducing the crop’s reproductive ability (reduction in yield contribution from branches).
- Expected Profit Simulation
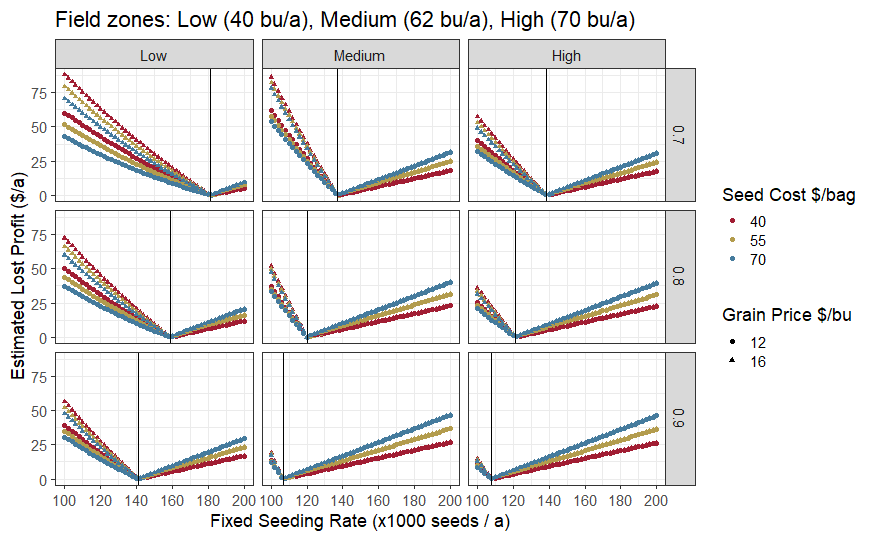
For site-specific management, the previous information can be used to generate prescriptions for variable rate seeding. Within a field, seeding rates can be adjusted for different zones within the field. This can improve profitability in various ways. For example, lower seeding rates could be used in certain zones, thus improving profitability by reducing seed costs and/or reducing the risk of unnecessary risk of lodging and disease development. Maintaining a fixed seeding rate for the whole field can reduce profitability compared to using a variable seeding rate. Figure 2 shows a simulation of potential lost profit ($/a) for not adjusting seeding rate by yield environment. The simulation comprises different scenarios with yield environments ranging from 40 to 70 bu/a, three survival rates (0.7, 0.8, and 0.9), two soybean grain market prices of ($12 and $16/bu), and three potential costs per bag of 140,000 seeds ($40, $55, $70/bag).
For a given field, the potential lost profits ($/a) will increase when using fixed seeding rates for the whole field compared to using optimal rate for each yield environment zone (vertical lines). Regardless of the environment, conditions that reduce the survival rate will increase the seed costs, as they increase the seeding rate needed to achieve the optimal plant density.
On the one hand, a farmer may be using a fixed seeding rate for the whole field that is “below” the optimal rate for some of the yield environment zones within the field. In that case, adjusting the seeding rate for each zone will reduce the potential lost profit since achieving the extra-yield will more than compensate for the additional seed cost. On the other hand, if a farmer is currently using a fixed seeding rate for the whole field that is “above” the optimal rate for a some of the yield environment zones within the field, reducing the seeding rate to the optimal for each zone will reduce the potential lost profit due to investing in unnecessary seeds.

Figure 2. Simulation of lost profit per acre for NOT adjusting seeding rates by yield environment (Low, Medium, High) at three plant survival rates (0.7, 0.8, 0.9) and six combinations of seed cost ($40, 55, 70/bag) and grain price ($12, 16/bu). Hypothetical yield environments range from 40 to 70 bu/a. Hypothetical seed costs are based on 140,000 seeds per bag. The vertical lines indicate the optimal seeding rate for each situation.
For more information about the optimal soybean seeding rates and optimal plant densities, please, consult https://bookstore.ksre.ksu.edu/pubs/MF3460.pdf
- Final considerations
- In summary, adjusting seeding rates based on plant survival rates, soil conditions, and planting dates can reduce the risk of yield and profit losses due to suboptimal densities in a low yield environment, while limiting higher seed costs due to supra-optimal densities, especially for medium and high yield environments. Moreover, soybean plant density levels above the optimal plant density increase the risk of lodging and disease development without adding a yield benefit.
- If planting early, try to maximize plant survival and reduce threatens to emergence by:
- Avoiding planting when soil temperatures are below 60°F. If planted into soils cooler than 60°F, seedlings may eventually emerge but will have poor vigor.
- Treating seeds with fungicide and insecticide.
- Selecting varieties with resistance to soybean cyst nematode and sudden death syndrome.
Ignacio Ciampitti, Farming Systems Specialist
ciampitti@ksu.edu
Adrian Correndo, Postdoctoral Fellow
Tags: soybeans seeding rate