Current crop condition
The 2023-24 winter wheat crop in Kansas was off to a good start in the fall, where even precipitation events across the state resulted in good crop establishment. Precipitation events occurred at different times for western (mid-September) and central (October) Kansas, predominantly matching good planting timings for these regions. This, coupled with winter snowfall and rain, led to over 50% of the winter wheat crop being rated as good or excellent by the USDA-NASS. Perhaps the largest exception was the area starting around Hays and moving north and west, which missed many of the precipitation events and where the crop did not emerge until later in the fall or, at times, in the spring.
The winter was also fairly warm, and more temperature accumulated, leading to a more advanced crop development than historical averages (Figure 1). For example, southeast Kansas has accumulated over 1000 growing degree units since January, more than double the historical average. Consequently, the estimated growth stage of the crop is somewhere during stem elongation, between jointing and boot, when historically the crop should still be just moving from the tillering stage to double ridge or first hollow stem (Figure 2). Likewise, central Kansas has accumulated over 750 GDD temperatures placing the estimated crop growth stage around the beginning of stem elongation (prior to jointing), when normally the crop would still be at the tillering stages. Similarly, the crop in Northwest Kansas, which would typically be nowhere near the end of tillering (~250 GDD), is reaching almost 500 GDD, indicating the end of tillering.
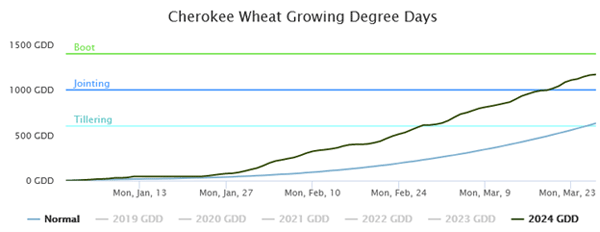
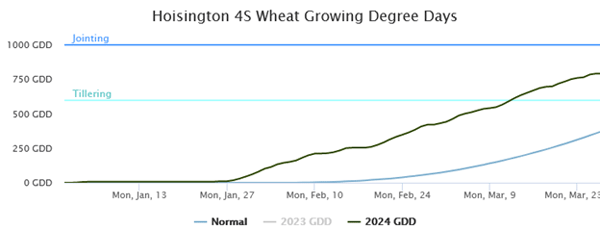
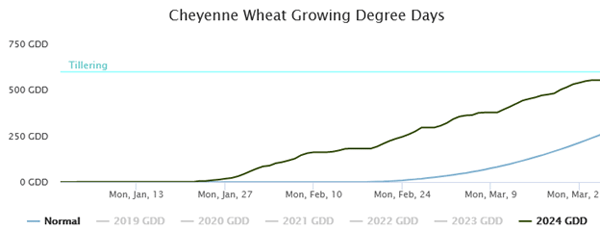
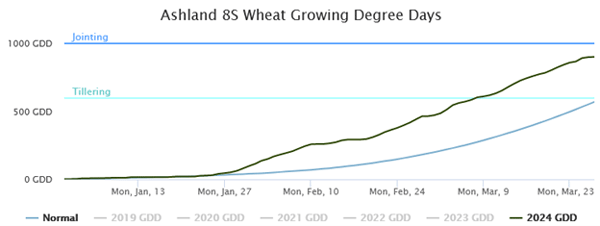
Figure 2. Cumulative growing degree days and simulated crop developmental stage for Cherokee (southeast), Hoisington (central), Cheyenne (northwest), and Ashland (southwest). The blue line denotes the long-term normal, and the green line denotes the current year. Graphs can be created at https://mesonet.ksu.edu/agriculture/wheat/gdd.
Potential for freeze injury during March 26-27
Cold air temperatures occurred during March 26-27, which could potentially cause freeze injury to the 2024 Kansas wheat crop. Factors that influence the potential for freeze injury to wheat include primarily:
- Growth stage of the crop
- Air temperatures
- Duration of cold temperatures
- Soil temperatures
- Snow cover
Other factors, such as position in the landscape and the presence of residue covering the soil surface, might also impact the extent of freeze damage within a field. The challenge is integrating all these factors into a reasonable estimate of freeze injury.
Wheat growth stage around Kansas
Based on simple wheat development models, the wheat growth stage around Kansas ranges from upright tillers in the northwest to the early jointing stage in central Kansas to later jointing and reaching flag leaf emergence in south-central and southeast Kansas (Figure 2). For fields that have not jointed yet, the crop can generally withstand temperatures of 15-20°F fairly well, especially if the growing point is still below ground. Kansas Mesonet data indicates that temperatures fell below this threshold, reaching as low as about 10°F in parts of northwest Kansas (Figure 3, top map), suggesting that some injury could be sustained.
If the growing point is already above ground (first joint visible), wheat can sustain temperatures down to about 24 degrees F for a few hours. Minimum temperatures below 24°F for extended periods of time increase the risk of crop injury. Information from the K-State Mesonet indicates that air temperatures were around this 24°F threshold in most of central and north-central Kansas; however, they dipped below the threshold for as many as 17-21 hours in southwest Kansas (Figure 3, bottom map), which can cause damage to fields at the first node of development or more advanced stages.
More advanced fields, such as the second node to flag leaf emergence (southeast Kansas), are more vulnerable to freeze injury, as temperatures near the 24-28°F threshold can cause injury. Minimum temperatures did not seem to fall below these sensitive thresholds in those parts of the state (Figure 3, bottom map).
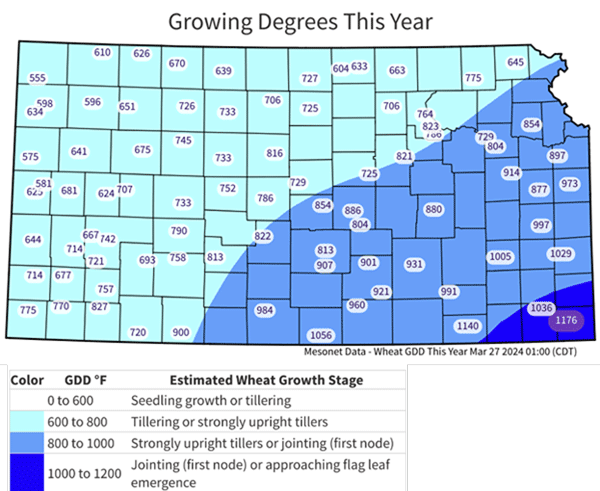
Figure 2. Estimated wheat growth stage as of March 27, 2024. Growth stage is estimated for each county based on temperatures accumulated in the season. Local growth stage may vary with planting date and variety. The KSU Wheat GDD Growth Stage model is available at: https://mesonet.k-state.edu/agriculture/wheat/gdd/
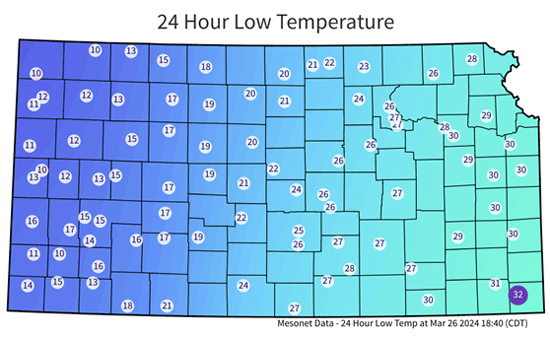
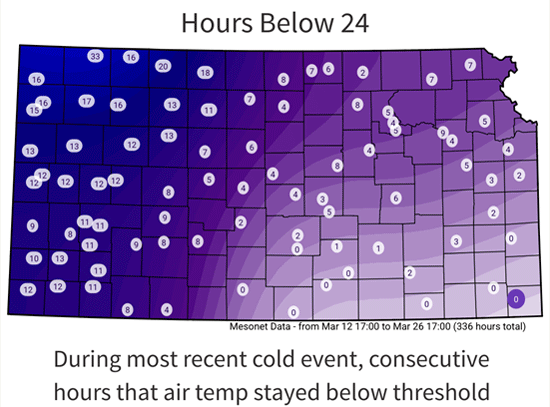
Figure 3. Minimum temperatures observed during the March 26-27 period (upper map) and number of hours below 24°F (lower map) observed during the coldest event during the specified period. Data from https://mesonet.k-state.edu/airtemp/min/hoursbelow/.
Soil temperatures
Soil temperatures can help buffer freezing air temperatures if the growing point is below ground or near the soil surface. However, its buffering capacity decreases as the crop develops and the growing point moves above the soil surface. Thus, we can expect a positive effect from soil temperatures in the majority of the state since soil temperatures did not reach levels below ~35 degrees F (Fig. 4), with exception of southeast where the crop is further along and the growing point is well into the canopy.
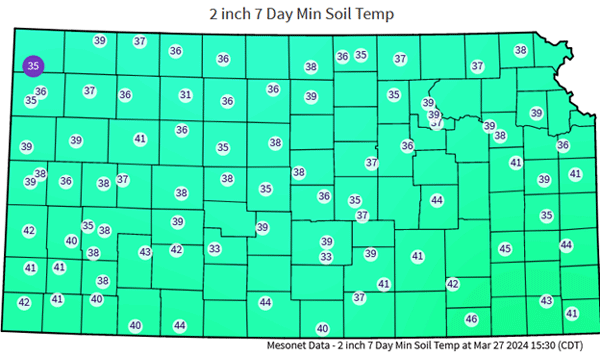
Figure 4. Minimum soil temperatures measured at 2 inch depth observed during the 7 day period preceding March 27. Data from https://mesonet.k-state.edu/agriculture/soiltemp/.
Integrated risk of freeze injury to Kansas wheat
Based on the factors explained above, we estimate that parts of southwest Kansas would be more exposed to the potential freeze damage, given that the crop is relatively advanced (at or past jointing) and was met with many hours of air temperatures below 24°F, with lowest temperatures reaching 13°F. This high-risk area corresponds to (1) areas with more hours below the threshold for the predominant crop growth stage and (2) more advanced crop development with temperatures at or below the threshold for freeze damage for the corresponding stage.
In the remainder of the state, temperatures needed to cause damage at the observed crop stages were borderline, and therefore, we expect that only more advanced fields could sustain freeze damage.
Freeze injury symptoms on foliage should occur across the entire state over the next few days. In most cases, however, leaf burn injury alone should not result in any long-term damage to the crop, especially if moisture is available to help the crop recover the lost foliage. Freeze injury symptoms to the developing wheat head, such as a mushy, discolored/brown head, take slightly longer to be visible (10-14 days). Thus, growers with fields at advanced growth stages should check for potential injury to the developing head within this timeframe. For more advanced fields, other symptoms to look for include a yellow flag leaf emerging from the whorl (which would indicate a dead tiller) and wheat heads trapped within the boot and thus emerging from the side of the culm.
Romulo Lollato, Wheat and Forage Specialist
lollato@ksu.edu
Chip Redmond, Kansas Mesonet Manager
christopherredmond@ksu.edu