An El Niño-Southern Oscillation (ENSO) event is defined as five consecutive 3-month periods where the waters of the Pacific along the equator are either warmer or colder than normal. If the water measures at least +0.5 degrees Celsius (C) warmer, an El Niño exists. However, if the water measures (via satellite) -0.5 degrees Celsius (C) or cooler-than-average a La Niña is present. As indicated by the current sea-surface temperatures (Figure 1), a weak La Niña is present, and is expected to strengthen and persist through the spring.
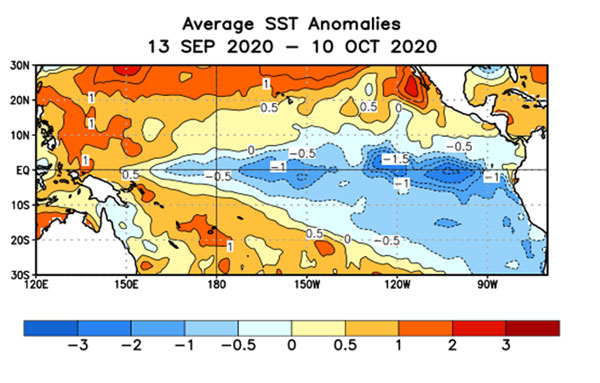
Figure 1. Current sea surface temperatures (SST) from the Climate Prediction Center.
The latest weekly Niño-4 index value was -0.8 degrees Celsius, and the Niño-3 and Niño-1+2 indices were at or below -1.0 degrees C. Based on the latest observations and forecast guidance, forecasters believe this weak-to-moderate La Niña (3-month Niño-3.4 values between -0.5°C and -1.5°C) will continue to strengthen, peaking around December, and persisting into the spring (Figure 2).
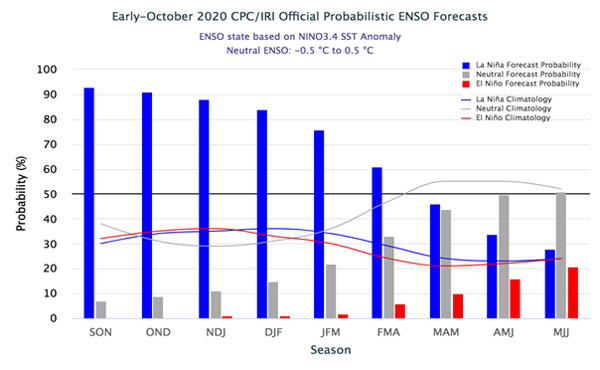
Figure 2. ENSO Forecasts (Climate Prediction Center)
What can Kansas expect during a La Niña winter?
For Kansas, of the previous eight La Niña events recorded since 2000 (Figure 3), only one event had a positive (above-normal) precipitation anomaly during the late fall/early winter season of November through January. During the 2011 event, the November to January departure from the 1981-2010 normal was +1.71 inches, while the average deficit is -0.70 inches.
This pattern of a negative anomaly is one of the factors guiding the Climate Prediction Center’s precipitation outlook for the period which was posted on October 15, 2020 (Figure 4).
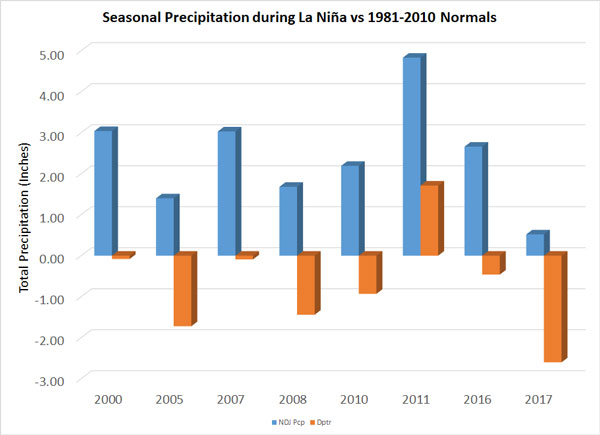
Figure 3. Seasonal observed and departures from normal during La Niña events in NDJ (November, December and January). Source: Weather Data Library.
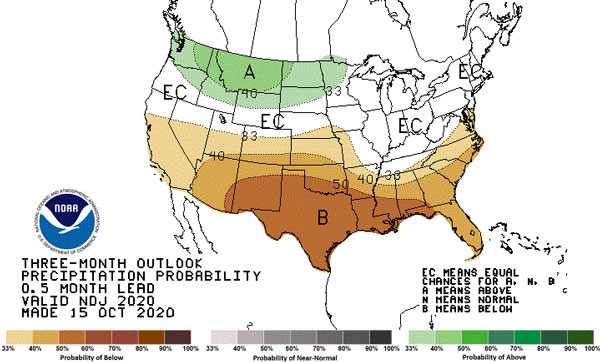
Figure 4. Three-month precipitation outlook (Climate Prediction Center)
As seen in the normal precipitation map below (Figure 5), November is critical to maintain and establish fall planted crops including winter wheat, canola, and cover crops. Even wetter-than-normal conditions are unlikely to improve the current drought conditions which have accumulated substantial precipitation deficits over the last 30 days (Figure 6).
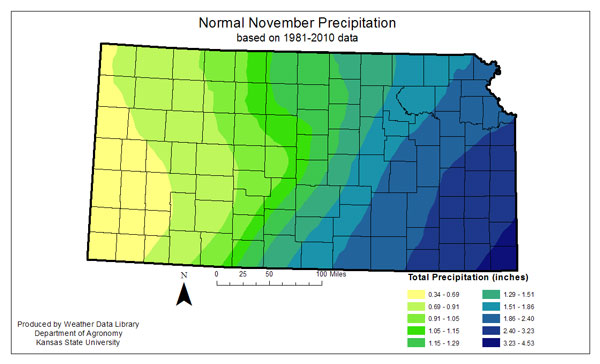
Figure 5. Normal precipitation in Kansas for November from 30 years of data (1981-2010).
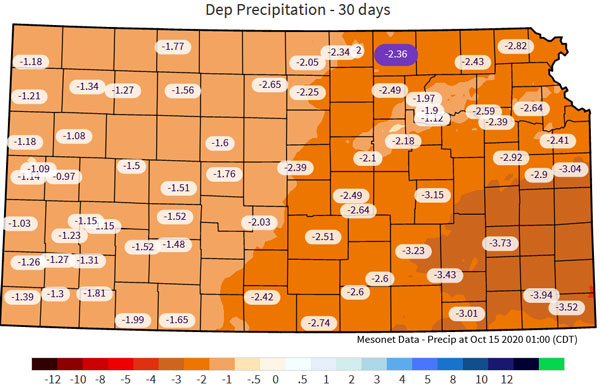
Figure 6. Departures of normal precipitation on the Kansas Mesonet (mesonet.ksu.edu) for the last 30 days ending on October 15, 2020. Normal consists of 30 years of data (1981-2010).
Mary Knapp, Weather Data Library
mknapp@ksu.edu
Christopher (Chip) Redmond, Kansas Mesonet
christopherredmond@ksu.edu