Satellite and drone-based remotely sensed imagery are becoming an important tool in monitoring crop health, soil nutrient and moisture status, weed identification, and pest disease stress detection to make on-farm decisions. The application, as well as the quality of decisions based on this imagery, will depend on various factors, including the resolution of the imagery or data.
Types of Resolution in Remotely Sensed Imagery
Spatial resolution refers to the ability of a sensor (such as on a drone or satellite) to distinguish different objects in the field. It is usually described by pixel size: the smaller the pixel, the more detail can be seen. In other words, smaller pixels mean higher resolution.
The resolution you need depends on your objective. For example, for stand counts, weed detection requires higher-resolution imagery, roughly 3.3 to 16.4 feet per pixel. Drones typically capture images at the centimeter (<inch) scale, allowing for analysis at the individual plant level (Figure 1). Satellites generally provide lower-resolution imagery suited for whole-field or regional monitoring, rather than plant-level detail. For comparison, Landsat 8 and 9 provide ~98 feet per pixel, Sentinel-2 provides ~33 feet, and commercial satellites such as PlanetScope provide ~10 feet.
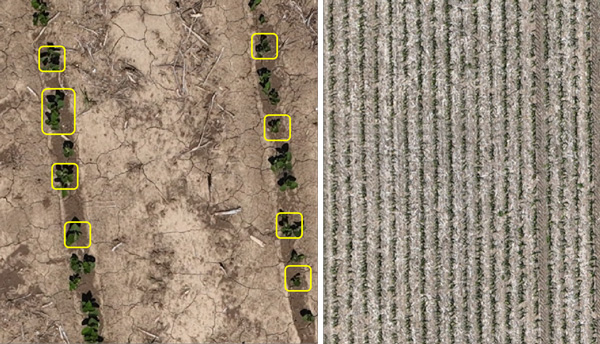
Figure 1. Ultra-high-resolution drone imagery (0.07 inches/pixel) is used to count soybean plants at the early-emergence stage (left photo). High-resolution drone imagery (0.94 inches/pixel) reveals the within-row structure in corn, enabling clear visualization of plant spacing, gaps, and row uniformity (right photo). Images by Deepak Joshi, K-State Research and Extension.
Spectral resolution refers to how many “spectral bands”, or in simpler terms, different colors, a sensor can detect. More spectral bands provide more information. For instance, most phone cameras capture three bands (red, green, and blue, or RGB), which is the same range visible to the human eye. RGB imagery is useful for tasks such as stand counts, weed detection, and assessing hail damage, but it cannot capture information beyond visible light (Figure 2, left).
Multispectral, thermal, and hyperspectral sensors can detect additional wavelengths such as near-infrared (NIR), red-edge, or thermal bands. These allow us to identify nitrogen deficiencies, drought stress, or pest-related injury earlier than what is possible with the human eye or RGB sensors (Figure 2, right).
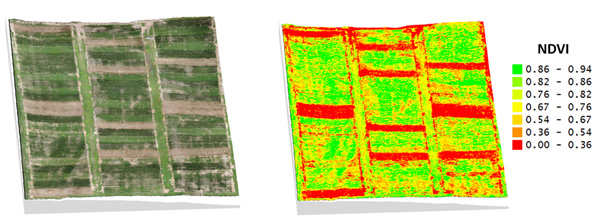
Figure 2. RGB vs. multispectral normalized difference vegetation index (NDVI) in small research plots. The RGB image (left) provides visual context of plot layout, soil/residue, and row patterns, while the NDVI map (right) quantifies canopy vigor (0–1), exposing subtle within-plot variability and stress bands that are not evident in RGB alone. Images by Deepak Joshi, K-State Research and Extension.
Temporal resolution describes how often images are captured (i.e., how many images we can get in a growing season). For example, Landsat 8/9 satellites provide images about every 8 days, while Sentinel-2 (2A+2B) provides images about every 5 days—though cloud cover often limits their usability. Drones, by contrast, can collect imagery as often as needed, provided conditions are favorable (no rain or strong winds).
Temporal resolution is especially important in agriculture, where images taken at different crop stages support better decision-making. For example:
- Before planting: monitor soil moisture and pre-emergence weeds.
- Early germination: conduct stand counts.
- Early to late vegetative growth: monitor nutrient status, pest pressure, disease, and moisture stress.
- Late reproductive stages: estimate crop yield.
Radiometric resolution refers to the different levels of brightness a sensor can distinguish in the images. It is usually measured using “bits”. An 8-bit image has 256 shades (brightness levels), a 12-bit image has 4,096, and a 16-bit image has 65,536. Images with more shades have finer detail in tone, which can reveal subtle differences in the crop or soil, such as mild nutrient stress or slight changes in moisture.
Table 1. Different resolution combinations for typical farm operations are provided as starting points; however, the best combination should be determined based on weather, crop stage, equipment, and local field conditions. (NIR=near infrared)
|
Farm Activity |
Spatial resolution |
Spectral Resolution |
Temporal Resolution |
Radiometric Resolution |
Reason for this resolution |
|
Emergence/ stand count |
0.39–1.97 in (drone) |
RGB is sufficient |
On-demand, ideally 3–7 days after emergence |
8-bit is ok; 12-bit is better |
To identify individual seedlings |
|
Early-season weed detection |
1.18–3.94 in (drone) |
RGB / Multispectral with NIR and red edge |
Every 7–14 days until canopy closure |
12-bit |
Distinguishes weeds from crops between rows |
|
Disease/insect/ moisture stress scouting |
3.94–11.81 in (drone) |
Multispectral, including NIR and red-edge/ thermal |
Weekly during vulnerable stages |
12-bit+ |
Captures leaf/canopy patterns |
|
Nutrient/zone delineation for variable rate application |
0.98–32.81 ft (Drone/high resolution satellite) |
Multispectral, including NIR and red-edge/ thermal |
At critical growth stages of crops (e.g., V6–V8 corn; Feekes 5–7 wheat) |
12-bit+ |
Can identify within-field variability |
|
Whole-farm monitoring & crop progress |
9.84–32.81 ft (high resolution satellite) |
Multispectral, including NIR and red-edge/ thermal |
Weekly during the growing season |
12-bit |
Field-level patterns, cost-effective |
|
Regional benchmarking, long-term trends |
32.81–98.43 ft (satellite) |
Multispectral, including NIR and red-edge/ thermal |
Biweekly to Monthly |
12-bit |
Greater area coverage and cost-effective |
Conclusions
Remote sensing offers several types of resolution—spatial, spectral, temporal, and radiometric. The right choice depends on your specific objective. By matching the type and resolution of imagery (from drones or satellites) with the questions you want answered, you can make more precise and timely on-farm decisions (Table 1).
Deepak Joshi, Precision Ag Extension Specialist
drjoshi@ksu.edu
Sarah Lancaster, Weed Science Extension Specialist
slancaster@ksu.edu
Logan Simon, Southwest Area Agronomist
lsimon@ksu.edu
Tina Sullivan, Northeast Area Agronomist
tsullivan@ksu.edu