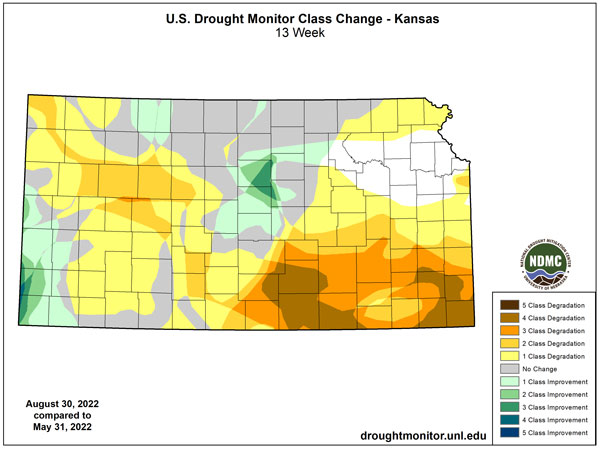
The meteorological summer of 2022 began on June 1 and ended on August 31. Between those two dates Kansans endured a dry, hot summer. As a result, drought conditions deteriorated (Figure 1) to the worst we have seen in nearly a decade. Historically speaking, where does summer 2022 rank on the lists of driest and hottest years?

Figure 1. Change in drought status in Kansas during meteorological summer 2022. Source: National Drought Mitigation Center
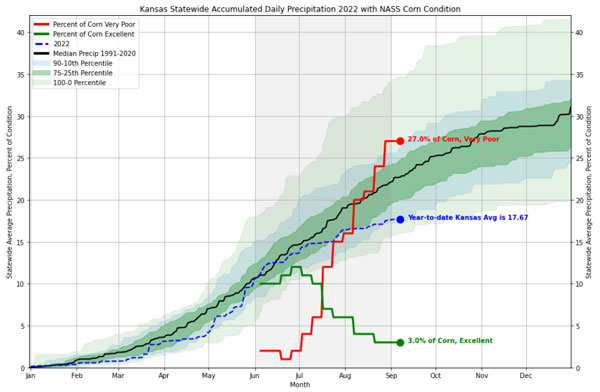
2022 was near the climatological median entering the summer months. However, it quickly deviated towards drier than normal as the dry periods began to add up. At the end of August, Kansas was running near the 10th percentile in yearly accumulated precipitation. Kansas should average about 22 inches of rain statewide. However, this year Kansas has only observed a little over 17.5 inches. This is not ideal timing for dry conditions as summer crops require timely moisture. As a result, the condition of corn has progressively decreased through the summer. Only 3% is considered in “Excellent” condition and 27% considered “Very Poor” according to USDA NASS data. The degradation of conditions matches very well with the trend downward in accumulated precipitation (Figure 2).

Figure 2. Accumulated statewide precipitation compared to climatology, plotted with previous and current corn crop condition from USDA NASS.
A closer look at this summer
Looking at data at a more local level, the nine Kansas climate divisions have climate data as far back as 1895. Table 1 shows how 2022 ranks against the previous 127 prior years of data. Each climate division ranked within the top 50 on both the lists of warmest and driest summers on record. Many areas ranked much higher, as both northwest and west central Kansas finished in the top 10 on both lists. Northeast Kansas was the only division to not rank in the top quarter of warmest summers; it barely missed, ranking as 33rd warmest out of 128 years. Southwest and south central Kansas both finished as 10th warmest, and southeast and central both finished in the top 20. Statewide, summer 2022 ranks as the 18th warmest on record. For precipitation, only east central finished outside the top third of driest summers, but its rank of 46th is still well inside the top half of driest summers despite averaging less than an inch below normal. All other regions averaged from 1.5 to 3.8 inches below normal for summer. Statewide, summer 2022 ranks as the 20th driest on record.
Table 1. Statewide and climate division averages, departures from normal, and rankings for meteorological summer 2022 (June-July-August, abbreviated JJA here) and for each individual month for temperature. Departures from normal are based on normals for the period 1991-2020. Rankings are based on the period 1895-2022.
|
Div. # |
Region |
Temperature (rank-warmest season/months) |
|||||
|
2022 Average (°F) |
Departure (°F) |
JJA Rank |
June Rank |
July Rank |
August Rank |
||
|
1 |
Northwest |
77.4 |
+3.2 |
6 |
20 |
14 |
20 |
|
2 |
North Central |
77.7 |
+1.4 |
29 |
32 |
65 |
36 |
|
3 |
Northeast |
76.8 |
+0.6 |
33 |
28 |
70 |
43 |
|
4 |
West Central |
78.1 |
+2.8 |
10 |
32 |
15 |
24 |
|
5 |
Central |
79.4 |
+1.8 |
18 |
34 |
38 |
24 |
|
6 |
East Central |
78.3 |
+1.6 |
21 |
27 |
36 |
37 |
|
7 |
Southwest |
79.4 |
+2.7 |
10 |
33 |
11 |
30 |
|
8 |
South Central |
80.9 |
+1.9 |
10 |
37 |
19 |
25 |
|
9 |
Southeast |
80.2 |
+2.4 |
14 |
30 |
13 |
23 |
|
Statewide |
78.6 |
+2.1 |
18 |
29 |
25 |
31 |
|
If we look at each of the three months individually (Table 2), we see that the statewide rankings for warmest months are all quite similar, ranging from 25th to 31st warmest. Northwest Kansas ranked in the top 20 for all three months, which led to 2022 ranking as their 6th warmest summer on record. Rankings for precipitation are more variable, especially in July when precipitation was above normal in northeast and north central Kansas. Unfortunately, this precipitation was focused in the latter part of the month, after a significantly hot and dry two-to-three weeks. This resulted in significant corn pollination issues, even in irrigated crops (https://eupdate.agronomy.ksu.edu/article_new/drought-and-heat-stress-in-kansas-corn-fields-507-3).
Table 2. Statewide and climate divisional averages, departures from normal and rankings for meteorological summer 2022 (June-July-August, abbreviated JJA here) and for each individual month for precipitation. Departures from normal are based on normals for the period 1991-2020. Rankings are based on the period 1895-2022.
|
Div. # |
Region |
Precipitation (rank-driest season/months) |
|||||
|
2022 Average (inches) |
Departure (inches) |
JJA Rank |
June Rank |
July Rank |
August Rank |
||
|
1 |
Northwest |
5.02 |
-3.94 |
7 |
20 |
64 |
6 |
|
2 |
North Central |
8.14 |
-2.14 |
30 |
32 |
101 |
5 |
|
3 |
Northeast |
10.48 |
-2.09 |
33 |
44 |
88 |
17 |
|
4 |
West Central |
4.61 |
-3.83 |
6 |
17 |
77 |
7 |
|
5 |
Central |
8.87 |
-1.60 |
41 |
68 |
49 |
12 |
|
6 |
East Central |
11.47 |
-0.86 |
46 |
45 |
69 |
40 |
|
7 |
Southwest |
6.00 |
-2.21 |
28 |
62 |
75 |
3 |
|
8 |
South Central |
6.65” |
-3.49” |
20 |
83 |
28 |
4 |
|
9 |
Southeast |
9.25” |
-2.91” |
28 |
80 |
18 |
23 |
|
Statewide |
7.71” |
-2.56” |
20 |
31 |
53 |
7 |
|
August was the driest month of the three (Table 3). All nine climate divisions had below-normal precipitation. Amounts averaged under one inch in five of the nine divisions, where departures for the month ranged from 1.47 to 2.25 inches below normal for August. As a result, all five of these regions ranked in the top 10 driest Augusts on record, led by southwest Kansas where it was the third driest August on record, ranking only behind 1913 (0.50”) and 1983 (0.65”). South central finished August as 4th driest, and north central finished as 5th driest. Northwest (6th) and west central (7th) also had a top 10 driest August. Impacts were observed in hay, corn, and especially soybeans (https://eupdate.agronomy.ksu.edu/article_new/drought-and-heat-stress-in-kansas-soybean-fields-508-1).
Table 3. Statewide and divisional average precipitation and departure from normal for August, 2022. Normals are based on the period 1991-2020.
|
Div. # |
Region |
August Precipitation (inches) |
|
|
2022 Average |
Departure |
||
|
1 |
Northwest |
0.88 |
-1.68 |
|
2 |
North Central |
0.90 |
-2.19 |
|
3 |
Northeast |
1.92 |
-1.80 |
|
4 |
West Central |
0.92 |
-1.47 |
|
5 |
Central |
1.26 |
-1.96 |
|
6 |
East Central |
2.65 |
-0.99 |
|
7 |
Southwest |
0.70 |
-1.72 |
|
8 |
South Central |
0.66 |
-2.25 |
|
9 |
Southeast |
1.74 |
-1.78 |
|
Statewide |
1.24 |
-1.77 |
|
While no individual location finished the month with no rain, there was one CoCoRaHS observer in Barber County (0.4 miles west-southwest of Medicine Lodge) who reported only a trace of rainfall for the month. Three CoCoRaHS observers in nearby Pratt County reported 0.1inches of rain or less. The airports at both Garden City (0.16 inches; 2nd driest since 1894) and Dodge City (0.32 inches; 3rd driest since 1875) also were extremely dry.
What does this mean for fall? You can read about the fall outlook here: https://eupdate.agronomy.ksu.edu/article_new/2022-fall-weather-outlook-for-kansas-509-6.
Matthew Sittel, Assistant State Climatologist
msittel@ksu.edu
Christopher “Chip” Redmond, Kansas Mesonet Manager
christopherredmond@ksu.edu