Warm and dry for most, wet for a fortunate few
The fourth full month of the growing season concluded on July 31, which for meteorological purposes is considered to have begun on April 1. We have had a few periods of above-normal weather this growing season, but there were also extended periods of below-normal temperatures, particularly in July. Precipitation has varied across the state, as is typical with convective thunderstorms. Where does Kansas stand with respect to normal temperatures and precipitation for the 2024 growing season? In this report, we take a closer look at some summary statistics.
Figure 1 shows the departure from normal temperature for the growing season to date across Kansas. Almost the entire state is above normal, with a few parts of central and southeast Kansas running over 3 degrees above normal. While the official averages for July have not been released yet, the average temperature for April, May, and June combined ranks in the top 10 warmest in 130 years of records in all nine of Kansas’ climate divisions. July is likely to finish a little below normal, despite the month finishing on a very hot note.
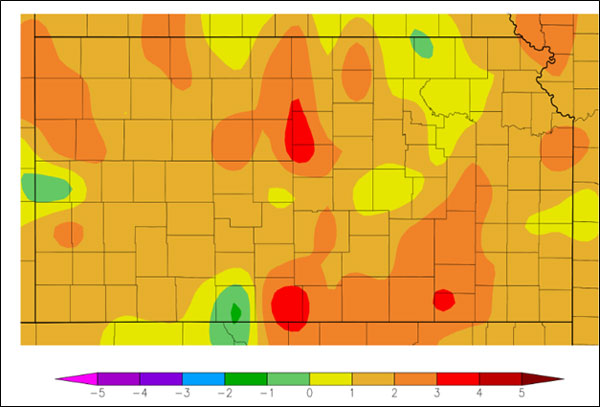
Figure 1. Departure from normal temperature for the growing season to date. Source: HPRCC.
Table 1 contains data for 20 observing sites around the state. Included are the number of days with highs at or above 90 and 100 degrees as well as total precipitation for the period April 1st through July 31st. The average counts for temperatures and departures from normal precipitation are also included for comparison. Despite the near unanimity of the departure from normal temperatures in Figure 1, there are mixed results for the temperature counts at this point in the season. Around half the locations have had more 90 and 100-degree days, while the rest are either below or exactly at normal. In general, counts are close to normal. Still, the northeast Kansas locations are running well behind due in part to this division having received above-normal precipitation combined with below-normal temperatures during what is usually the hottest month of the year. Northeast Kansas received, on average, around two and a half inches above normal precipitation from April 1st through June 30th. It takes more solar energy to warm moist air and wet ground than dry, so places with above-normal precipitation are often a bit cooler in summer. Only seven of the 20 locations in Table 1 are above normal for growing season precipitation, and all of them are running at or below normal on both 90 and 100-degree days. The majority of the sites with below-normal precipitation are running ahead of normal for the counts of very hot days.
Table 1. Counts of 90 and 100-degree days (°F) so far this growing season, and precipitation since April 1. Blue and orange cells indicate below average; pink and green cells indicate above average. Averages and departures from normal are based on 30-year normals for the period 1991-2020, calculated using data from the National Centers for Environmental Information.
|
Location |
90° Days |
100° Days |
Precipitation |
|||
|
2024 |
Avg |
2024 |
Avg |
2024 |
Dep. |
|
|
Ashland |
45 |
49 |
11 |
13 |
12.83 |
+0.91 |
|
Chanute |
40 |
27 |
4 |
2 |
19.33 |
-0.44 |
|
Concordia |
36 |
31 |
8 |
5 |
14.02 |
-0.83 |
|
Dodge City |
39 |
42 |
7 |
9 |
15.99 |
+4.65 |
|
Elkhart |
40 |
46 |
12 |
9 |
8.70 |
-0.68 |
|
Emporia |
33 |
25 |
5 |
3 |
12.80 |
-5.84 |
|
Garden City |
38 |
43 |
8 |
11 |
8.12 |
-2.54 |
|
Goodland |
38 |
31 |
11 |
5 |
5.55 |
-4.99 |
|
Hill City |
45 |
36 |
15 |
9 |
8.24 |
-4.46 |
|
Horton |
15 |
26 |
0 |
2 |
22.31 |
+2.85 |
|
Hutchinson |
42 |
37 |
11 |
7 |
9.73 |
-5.70 |
|
Lawrence |
35 |
25 |
2 |
2 |
19.39 |
-0.26 |
|
Manhattan |
24 |
34 |
1 |
5 |
24.18 |
+5.43 |
|
Russell |
41 |
38 |
13 |
9 |
8.08 |
-5.48 |
|
Salina |
43 |
41 |
12 |
10 |
9.46 |
-5.97 |
|
Topeka |
29 |
29 |
2 |
3 |
18.43 |
+0.54 |
|
Tribune |
33 |
38 |
8 |
9 |
10.82 |
+1.03 |
|
Washington |
19 |
32 |
1 |
5 |
18.62 |
+1.83 |
|
Wichita |
39 |
38 |
8 |
7 |
11.09 |
-6.07 |
|
Winfield |
38 |
31 |
9 |
4 |
17.39 |
-3.07 |
Figure 2 shows the departure from normal precipitation across Kansas from April 1 to July 31. With respect to normal, more of the state is running behind than ahead for the growing season to date. The largest deficits are in the central third of the state. In parts of central and south central Kansas, the deficits exceed six inches. In Wichita, normal precipitation for this 4-month period averages 17.18”. In 2024, they have received only 11.09”, resulting in a deficit of 6.07” for the growing season. Salina has had just 9.46” of precipitation. Compared to the normal amount of 15.43”, their deficit is 5.97”. In both locations, the 2024 growing season to date is the driest since 2012. Meanwhile, parts of southwest and northeast Kansas are running above normal for the growing season. Dodge City recorded its wettest June on record this year, receiving just over 12 inches of rain. This one-month total is greater than their average precipitation for April to July! As a result, Dodge City is running over 4.5” above normal for the growing season to date. Manhattan is running nearly 5.5” above normal for the growing season, thanks to a very wet May in which a little over 9 inches of rain fell.
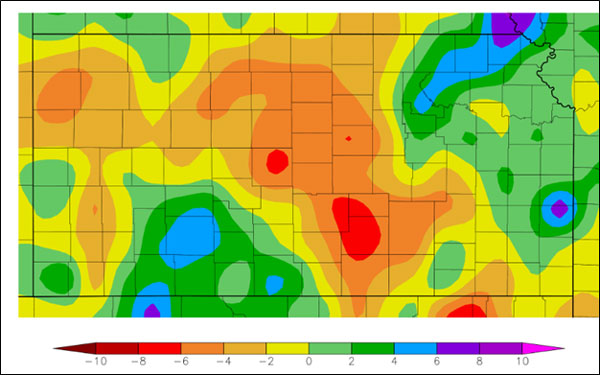
Figure 2. Departure from normal precipitation for the 2024 growing season through July 31. Source: HPRCC.
As August begins, Kansas is in an extended period of summertime heat. A run of below-normal temperatures ended, replaced by above-normal conditions late last month. July 30 was the hottest day this year, with an average high across the Kansas Mesonet of 101 degrees. Hill City reached 111° that afternoon, tying for the hottest reading in the state so far in 2024. In addition, precipitation has been scarce in many areas. In the last two weeks of July, many areas have seen below-normal rainfall. Locations receiving less than one-quarter inch of rain from July 18th through the 31st include Hutchinson (0.04”), Coffeyville (0.06”), Garden City (0.11”), and Winfield (0.16”). The combination of hot temperatures and little precipitation at this point in the growing season is certainly not good news.
The most recent US Drought Monitor update, released on August 1, saw 31% of the state moved from drought-free to D0 status. Just 11% of Kansas is now drought-free, compared to 53% just three weeks ago. The change in the drought category over the past month is shown in Figure 3.
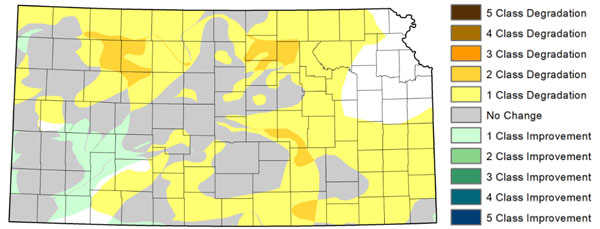
Figure 3. Change in the US Drought Monitor category across Kansas since the start of July 2024.
Looking ahead
How much longer will these conditions persist? The monthly temperature and precipitation outlooks for August were updated by the Climate Prediction Center on July 31(Figure 4). Unfortunately, the forecast maps favor a continuation of the prevailing weather conditions. There are better-than-even chances of above-normal temperatures in all but northeast Kansas. These same areas have elevated chances for below-normal precipitation. Northeast Kansas has equal chances of above and below-normal precipitation. Isolated thunderstorms could bring relief to a few areas, but pinpointing exactly where and when those may occur is impossible far in advance. Shorter lead-time forecasts from the seven local National Weather Service offices that serve Kansas will provide better guidance as to when and where rainfall may occur, as well as identify the magnitude and duration of high temperatures. But should the long-range forecast verify, we may very well see continued worsening of drought conditions across the state.
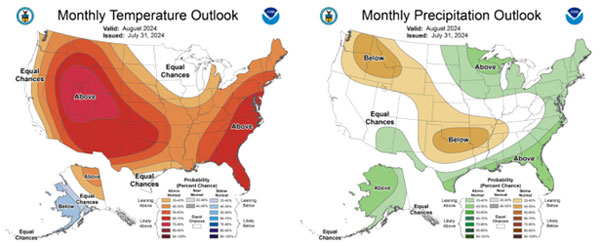
Figure 4. Temperature (left) and precipitation (right) outlooks for August 2024. Source: Climate Prediction Center.
Matthew Sittel, Assistant State Climatologist
msittel@ksu.edu