With most Kansas soybean fields already in reproductive stages, it is time to start assessing yield potential from those fields.
Soybeans can easily compensate for the occurrence of stress (relative to corn), more so if the timing of the stress is before seed filling. One of the key factors on the crop’s ability to compensate stress situations is the significant overlapping of vegetative and reproductive stages that indeterminate soybeans express, allowing them to keep producing new leaves even toward the reproductive period. On the other hand, the production of flowers could normally last between 4-6 weeks, which potentially allows to replace flowers and small pods abortion.
Since the final number of pods is not determined until reaching the beginning of seed filling, when estimating soybean yield potential, we must keep in mind that the estimate could change based on timing of this estimation and weather conditions. For example, wet periods toward the end of the reproductive period can extend the seed-set period, promoting greater pod production and retention, with heavier seed weight.
Estimating final yield before harvest can be a very tedious task, but a simplified method using yield components can be applied to start setting yield expectations.
From a physiological perspective, the main yield components to consider are:
- plants per acre,
- pods per area,
- seeds per pod, and
- seed size.
When can I start making soybean yield estimates?
There is not a precise time, but we can start making soybean yield estimates as soon as the end of the R4 stage, full pod (pods are ¾-inch long on one of the top four nodes), or at the onset of the R5 stage, beginning seed (seeds are 1/8-inch long on one of the top four nodes). Keep in mind that yield prediction is less precise at these early reproductive stages since the seed number per area, as well as the seed weight, are not yet completely defined. At this early stage of seed development, it is important to only consider the pods that are at least ¾-inch long to avoid over-optimistic estimations since smaller pods can still abort under stress conditions.
As far as we move into R6 stage (full seed), the seed number (main yield component) is significantly defined, yet the conditions during seed filling will determine the effective seed number as well as the size of the seed. The closest to maturity (R7 stage) that we move the estimation, the most accurate the expectation and overall yield prediction.
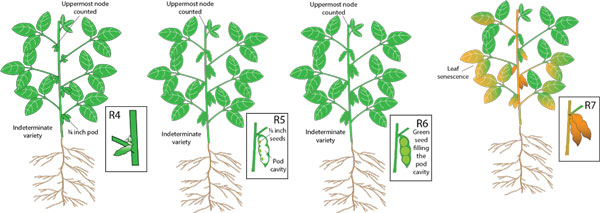
Figure 1. Soybean phenological stages to start yield prediction using the yield components method.
How many samples are needed to account for field variation?
Make yield estimations in different areas of the field, at least 6 to 12 different areas. It is important to properly recognize and identify the variation within the field, and then take enough samples from the different areas to fairly represent the entire field. Within each sample section, take consecutive plants within the row to have a good representation. The variability between plants in terms of number of pods and seed size needs to be considered when trying to get an estimation of soybean yields. In addition, variability between areas within the same field needs also to be properly accounted for (e.g. low vs. high areas in the field). In a nutshell, the more variability to represent, the more samples we would need for a good estimation.
The yield components equation
Soybean yield estimates following the conventional approach are based on the following components (Eq. 1):
Eq. 1
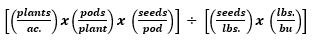
where,
- Plants/ac. A simplified approach can be applied by using samples covering 1/10,000th of an acre with sections of 30 inches width by 21 inches length (Figure 2, step 1.). Thus, the average of plants on several sections multiplied by 10,000 will give us an estimation of the numbers of plants per acre. Following this simplified approach, if the soybean plants are arranged in 30-inch rows we just need to sample a single row; 2 rows if the row spacing is 15 inches; and in 4 rows if the row spacing is 7.5 inches.
- Pods/plant. Once the samples have been obtained, we proceed to count and later average the number of pods per plant (Figure 2, step 2.).
- Seeds/pod. Then, we proceed to count and later average the number of seeds per pod (Figure 2, step 3.). Soybean plants will have, on average, 2.5 seeds per pod (ranging from 1 to 4 seeds per pod), primarily regulated by the interaction between the environment and the genotypes. Under severe drought and heat stress, a pessimistic expectation would be an average of 1-1.5 seeds per pod.
- Seeds/acre. A calculation of the total number of plants/ac (1)., pods/plant (2), and seeds/pod (3), obtaining the total number of seeds per unit area (Figure 2, step 4.).
- lbs/bu. For this estimation, the “test weight” for soybean could be considered here as a constant number at 60 lbs./bu.
- Seeds/lbs. The number of seeds per pound will vary depending the seed filling conditions, which will determine the seed size. Normally, this number could range somewhere between 2,500 (bigger seeds) to 3,500 (smaller seeds) seeds per pound, for optimal to unfavorable seed filling conditions. Combined with a constant test weight of 60 lbs./bu, this will lead to a range of expectation of seeds per bushel between 150,000 seeds per bushel to 210,000 seeds per bushel, respectively (Figure 2, step 5).
The final step to get the estimation consist in: (i) dividing seeds/acre by seeds/bu to obtain the yield estimation in bushels per acre (Eq. 2).
Eq. 2
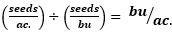
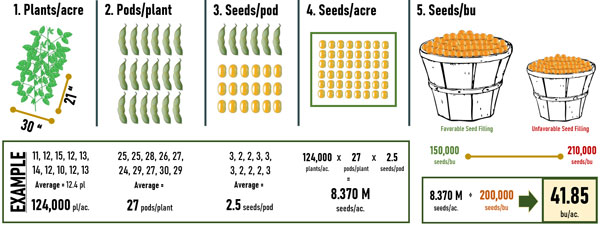
Figure 2. Example of yield estimation method using samples of 1/10,000th of an acre (21-inch x 30-inch sections) for a regular yield until seed filling, where the seed size is expected to be
reduced compared to favorable seed filling conditions, increasing the #seeds/bu component.
Example for average conditions
In Figure 2, we have taken 10 samples of 30x21 inches sections, leading to an average number of 12.4 plants. Since these sections are 1/10,000th of an acre, our first component, the plant density is 124,000 plants/acre. Then, in those 12 plants, we have measured on average 27 pods per plant. If we assume a “normal” growing season condition, then we could expect to count around 2.5 seeds per pod. Combining these components, we obtained an expectation of 8.370 M seeds per acre. Finally, we had to assume (if the estimation is early) or represent (if close to maturity) the seed filling conditions. In this case, we have used regular to poor seed filling due to the lack of precipitation combined with heat, thus we divided the seeds per acre by an expectation of 200,000 seeds per bu (small seed size), giving us an estimate of 41.85 bu/a.
Adjusting for 2022 expectations
So far, the 2022 season have shown a good start during May and June, but challenging conditions from drought and heat experienced during July and August. Thus, even if the pod number is the same as in a normal season, for a “droughty” (from R2 to R6 stages) growing season such as the present one, the final seed number will be negatively impacted. Therefore, a yield calculation for unfavorable conditions while defining the number of seeds per pod component could be as follows:
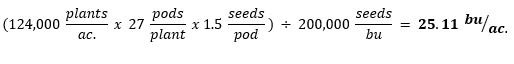
This situation could be more severe if the stress conditions started earlier in the reproductive period, impacting the final number of pods, and if the stress conditions are not alleviated in the coming weeks, severely reducing the final seed weight.
The practice of estimating yields in soybeans will provide an opportunity for farmers and agronomists not only to obtain a more reliable prediction of yields but to scout fields for associated issues before harvest, such as insects, diseases, and other potential production problems.
Ignacio Ciampitti, Professor - Farming Systems
ciampitti@ksu.edu
Adrian Correndo, Postdoctoral Fellow, Digital Ag
correndo@ksu.edu