Seed cost is a critical economic factor, and selecting the proper seeding rate is a key management practice. This article reviews key factors in determining optimal soybean seeding rates and row spacing.
Key terminology
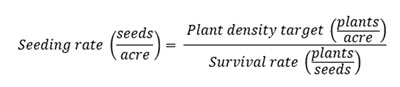
- Seeding rate refers to the target number of planted seeds per acre.
- Plant population or plant density refers to the effective number of plants growing in a field.
- Survival rate refers to the percent of sown seeds that germinate and emerge. Normally, we may expect about 80% of the seeds planted to survive and become part of the final plant population.
Calculating Final Plant Density to Calculate Seeds per Acre
It’s best to start by specifying the desired final plant density, then use the expected survival rate to calculate the number of seeds per acre you’ll need to plant.
Example of seeding rate calculation with a plant density target of 100,000 plants/acre and expected survival rate of 80% (0.8 plants/seed):
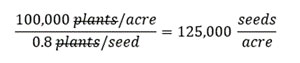
Note: The seed survival rate varies depending on specific environmental conditions and the quality of the planting practice. Thus, before deciding the seeding rates, it is necessary to consider potential soil and weather conditions that could affect the success of final stand establishment to achieve the proper plant density required.
Adjusting seeding rates by yield environment
Identifying yield potential for each environment in your field is a good practice to use when refining the soybean seeding rate decision. A study by Carciochi, Ciampitti, and others in 2019 evaluated soybean seed yield response to plant density by yield environment using a database of hundreds of experiments across the Midwest. Seeding rates ranged from 69,000 to 271,000 seeds/a. The data was classified by yield environments as follows: Low (<60 bu/a), Medium (60-64 bu/a), and High (>64 bu/a).
The main outcomes of this study were:
- Most probable values. On average, optimum plant densities were:
- Low-yield environments: 127,000 plants/a
- Medium-yield environments: 96,000 plants/a
- High-yield environment: 97,000 plants/a
- Expected uncertainty. In 50% of cases, optimum plant densities ranged from:
- Low-yield environments: 109,000 - 144,000 plants/a
- Medium-yield environments: 77,000 to 114,000 plants/a
- High-yield environments: 76,000 to 117,000 plants/a
- In low-yield environments, the need for higher optimal plant density was not related to a low plant survival rate, but to a reduced potential growth rate per plant.
- Another reason for the need for higher plant density in low-yield environments is that there is often less precipitation during the reproductive period in these environments, reducing the crop’s reproductive ability (reduction in yield contribution from branches).
Effect of row spacing on seeding rates and yield
The optimum soybean seeding rate is tied to other practices, such as row spacing and planting date (see companion article on soybean planting dates). The final number of seeds per linear foot of row decreases as row spacing narrows. For example, at a target plant density of 105,000 plants per acre and 85 percent germination, 30-inch rows will have twice the number of seeds per linear foot as 15-inch rows (6 vs. 3 seeds per linear foot). However, the seeding rate per acre would remain the same for both row spacings, as only the number of seeds per linear foot would change, not the seeding rate per acre.
There are still many questions about soybean row spacing. Six on-farm experiments in eastern and central Kansas were conducted from 2015 to 2017, one each in Franklin County, Hutchinson, Jefferson County, and Manhattan. For the 2017 season, two additional studies were conducted in Ashland Bottoms near Manhattan and Franklin County.
Compared to the conventional 30-inch row spacing, narrow row soybeans (15-inch or less) showed similar or slightly greater yields (2-12%), particularly in low-yield environments (< 60 bushels per acre), independent of planting date, seeding rate, or maturity. Above this yield threshold level, soybeans did not show a yield response to changing the row spacing (Figure 1). However, the data suggested that the response to row spacing is inconsistent, as indicated by the wide margin of error of responses and the variability between site years.
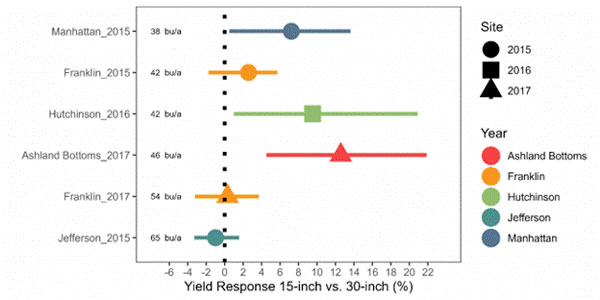
Figure 1. Observed yield response in soybeans to narrow rows (15-inch) compared to conventional spacing (30-inch). The average yield of 30-inch strips is indicated on the left side of the figure (bu/a).
Take-home message
Benefits of narrow row spacing:
- Early canopy closure for better light interception and improved weed control.
- Reduced potential for soil erosion.
Disadvantages of narrow rows:
- Potential reductions in the final stand at a given seeding rate due to equipment and within-row compaction.
- In very dry years, narrow row spacing may consume soil water earlier in the growing season, reducing the amount of water available for the critical period around pod-setting and seed filling.
- In wet years, very narrow spacing (less than 15 inches) may allow less airflow within the canopy and favor the occurrence of certain diseases, such as white mold.
Adjusting seeding rates based on plant survival rates, soil conditions, and planting dates can reduce the risk of yield and profit losses from lower-than-optimal densities in low-yield environments, while limiting higher seed costs from higher-than-optimal densities, especially in medium- and high-yield environments. Soybean plant density above the optimal level increases the risk of lodging and disease without yielding benefits.
Tina Sullivan, Northeast Area Agronomist
tsullivan@ksu.edu
Logan Simon, Southwest Area Agronomist
lsimon@ksu.edu
Eric Adee, Agronomist
eadee@ksu.edu
Tags: soybeans seeding rate row spacing