Ensuring optimum sowing date and seeding rate are two steps needed to help achieve the maximum wheat yield potential in a given growing season (Figure 1). Sowing date affects yield potential not only due to stand establishment and tiller formation, but especially as it changes the environment to which the crop is exposed at different phases of the cycle, affecting temperature and moisture regimes as well as disease pressure. Optimum seeding rate depends on sowing date and its adjustment is crucial to ensure the crop will maximize its yield potential.
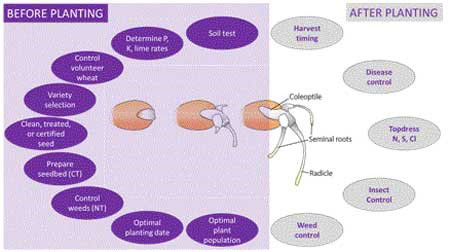
Figure 1. Best management practices before and after sowing to ensure maximum yield potential can be attained in a given growing season. Graphic by Romulo Lollato, K-State Research and Extension.
Sowing date
A) K-State recommendations
Optimum sowing date for winter wheat is quickly approaching for a large portion of Kansas (Figure 2). Depending on geographical location, optimum sowing window can start as early as September 10 and last until the end of September (northwest Kansas), or it can start as late as October 5 and last until October 20 (southeast Kansas). This gradient in sowing dates, with earlier dates in the northwest, is a function of temperature. Northwestern regions with higher elevations will have cooler air and soil temperatures earlier in the year as compared to southeastern regions.
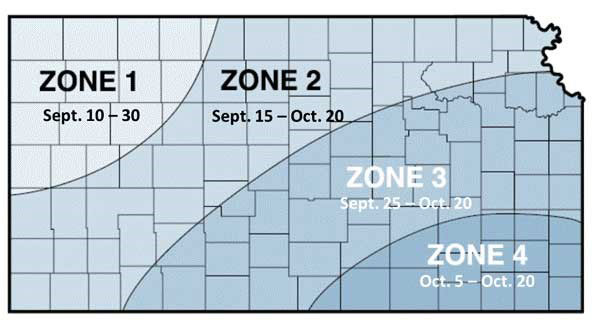
Figure 2. Optimum planting dates for winter wheat according to geographical location within Kansas. Figure adapted from KSRE publication L-818, Kansas Crop Planting Guide.
B) Actual Kansas wheat sowing dates
According to historical data released by the USDA-NASS crop progress reports, on average, producers in Kansas planted approximately 50% of the crop prior to October 4 and about 90% of the crop prior to October 25 during the 1994-2015 period (Figure 3).
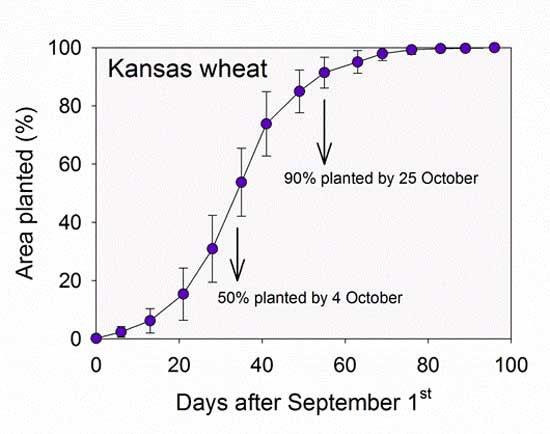
Figure 3. Average percent wheat area planted in Kansas after September 1st. Data represents average and standard deviation for percent planted area during the 1994 – 2015 period as reported by the USDA-NASS Crop Progress Reports (https://www.nass.usda.gov/Publications/National_Crop_Progress/).
Although 50% of the fields are, on average, planted by October 4, there is large year-to-year variability in percent planted area within the aforementioned date range (see error bars on Figure 3). This year-to-year variability is led by sowing conditions, as extremely moist or dry soils, may keep producers from sowing at the optimum planting date.
The largest variability of area planted in Kansas in the period 1994-2015 occurred between September 20 and October 15. During this period the difference in area planted between the earliest and the latest years on record was above 40% (Figure 4). In other words, while 50% of the wheat area was sown by September 21 in the earliest year on record, only 7% of the area was sown by the same date for the latest year on record. In the latest year, 50% wheat area sown was only achieved October 11. The variability in planted area was lower at earlier planting dates (before September 20), probably because most producers tend to wait until the optimum planting window with a smaller acreage planted early. Year-to-year variability in planted area also decreased towards the late planting window (after October 15), as most of the acreage had been planted by that time in most years.
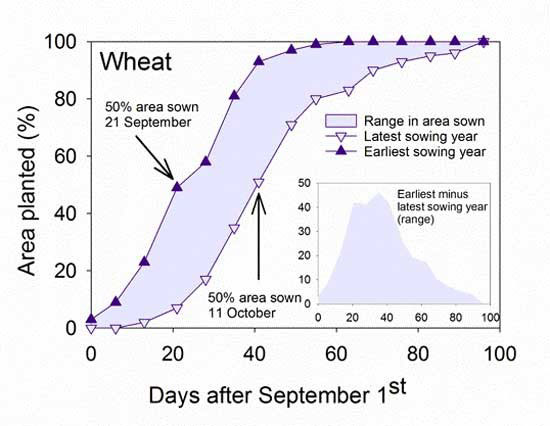
Figure 4. Percent wheat area planted in Kansas after September 1st for the earliest and latest years on record between 1994 and 2015 as reported by the USDA-NASS Crop Progress Reports (https://www.nass.usda.gov/Publications/National_Crop_Progress/). Range in area sown is shown as light purple area in the main graph. Inset shows the difference in percent area planted between the earliest and the latest sowing years on record.
C) Considerations of wheat growth affected by sowing date
- Sowing wheat early: Sowing wheat at an earlier-than-optimal date can result in lush vegetative growth, which will require more water to maintain the canopy later in the growing season. For that reason, producers who graze their wheat are encouraged to plant wheat two or three weeks earlier than the optimal sowing date for grain. Early sowing can also lead to an increased incidence of fall pest infestation, such as Hessian fly, and diseases transmitted by certain vectors are more active in warmer temperatures, such as wheat streak mosaic (transmitted by wheat curl mites) and barley yellow dwarf (transmitted by aphids). The consequences of an earlier-than-optimal sowing date are discussed in “Early planting of wheat can lead to several problems” from eUpdate issue 818 on September 11, 2020.
- Sowing wheat at the optimal time: The optimal sowing time differs year-to-year due to environmental conditions, such as temperature and precipitation, but the optimal winter wheat sowing range for different regions in Kansas is shown in Figure 2. Sowing wheat at the optimal time stimulates the right amount of fall tiller formation, as well as root development, to optimize yields while avoiding a lush vegetative growth. Fall-formed tillers contribute more to yield potential than spring-formed tillers, therefore it is crucial that about 3 to 5 tillers are well established before winter. Additionally, this tiller formation, combined with good crown root system development prior to winter dormancy, increases the winter hardiness of the crop, and the chances of winter survival.
- Sowing wheat late: Many reasons may lead producers to plant wheat late. Double-cropping wheat following a late-harvested summer crop, such as soybean or sorghum, is common in many regions of Kansas. Delayed planting date due to environmental conditions, such as low or high soil moisture levels, may also occur. When wheat is sown past the optimal window, it is generally sown into colder soils and the crop is exposed to cooler air temperatures during the fall. Sowing into colder soils will delay wheat emergence, so the importance of a seed fungicide treatment increases as planting date is delayed. Additionally, the crop will experience decreased fall tiller formation because wheat development is dependent on temperatures (Figure 5). An increase in seeding rates in these circumstances is warranted.
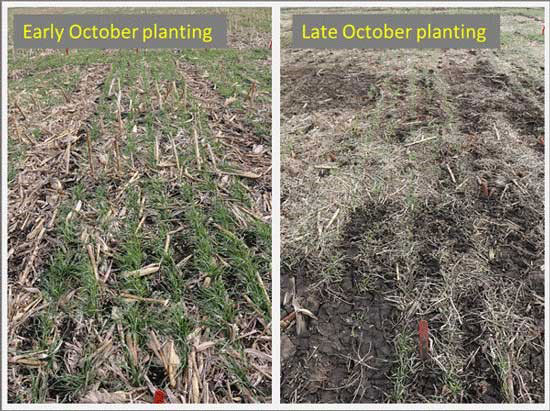
Figure 5. Difference in fall growth due to planting date following summer crops. Photos were taken December 8, 2016 from neighboring fields which were sown in early October in no-till following corn (left photo) or late October no-till following soybeans (right photo). Photos by Romulo Lollato.
Seeding rate
Optimum seeding rate varies with geographical location in Kansas, following the existing east-to-west precipitation gradient. If sown at the optimal date, optimum seeding rate should be about 1,125,000 – 1,350,000 seeds per acre in the eastern portion of the state, where annual precipitation is above 30 inches, or under irrigated conditions (Figure 6). Seeding rate should be decreased to 900,000 – 1,250,000 seeds/acre in the central region, where annual precipitation ranges between 20 and 30 inches. A further decrease in seeding rate should occur in the western third of the state where annual precipitation is less than 20 inches, for a final seeding rate between 750,000 and 900,000 seeds per acre in that region (Figure 6).
Seeding rate should always be discussed along with planting date, and in many times with soil fertility status as well. As mentioned above, later planting dates will decrease the potential number of fall tillers formed and grain yield will be more dependent on the main stem and maybe one or two tillers formed during the fall. Thus, seeding rate should be increased as planting date is delayed (for more information see “Management adjustments when planting wheat late” in eUpdate Issue 598).
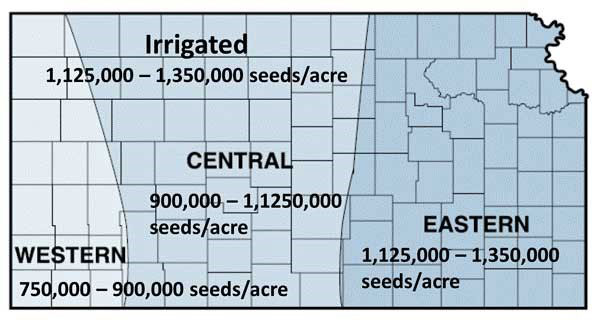
Figure 6. Optimum planting rates for winter wheat according to geographical location within Kansas. Figure adapted from KSRE publication L-818, Kansas Crop Planting Guide.
Romulo Lollato, Extension wheat and forage specialist
lollato@ksu.edu
John Holman, Cropping Systems Agronomist, Southwest Research-Extension Center
jholman@ksu.edu