When determining the optimal seeding rate for corn, it is important to remember the level of management, hybrid, and environment all interact with one another on the planted population. Producers may look back to their corn crop from the previous growing season or wait until the current growing season is nearly complete to evaluate whether the corn seeding rate they have used was adequate. Management factors often overlooked include planting date, nitrogen fertilization, row spacing, and crop rotation. All affect optimal planting rates differently.
Although specific hybrids can respond differently, the following guidelines may help decide if the selected corn seeding rates need to be adjusted.
- Few kernels per ear: if more than 5% of the plants are barren or most ears have fewer than 250 kernels per ear, the corn seeding rate may be too high.
- Too many kernels per ear: if there are consistently more than 600 kernels per ear or most plants have a second ear contributing significantly to grain yield, the corn seeding rate may be too low. The growing conditions can influence ear number and ear size, making it important to consider the growing conditions for that season when interpreting these plant responses.
- Tipping back: don’t be too concerned if a half-inch or so of the ear tip has no kernels. If kernels had formed to the tip of the ear, there may have been room in the field for more plants, which would have contributed to higher grain yield. Again, this "tipping back" will vary with the hybrid, management, and growing environment interaction.
- Irrigation: If fertilizer or irrigation rates are significantly increased or decreased, optimal corn seeding rates may need to be adjusted. For example, research at the Irrigation Experiment Field near Scandia (North Central KS) has shown that corn seeding rates also have to be increased to attain the maximum yield benefit if fertilizer rates are increased.
- Nutrient status: in addition to the growing conditions, nutrient status can also influence the final number of grains per ear. For example, severe nitrogen (N) deficiency will greatly impact the final number of grains, ear size, and ear number.
Keep in mind that the potential ear size and the potential number of kernels (1,000-1,200 per ear) are set before silking (R1), but the actual final number of kernels is not determined until after pollination and early grain fill (R2-R3) due to relative success of fertilization and degree of early kernel abortion.
Always keep long-term weather conditions in mind. In a drought year, almost any corn seeding rate is too high for the available moisture in some areas. Although it’s not a good idea to make significant changes to seeding rates based only on recent events, it is worthwhile considering how much moisture is currently in the soil profile and the long-term forecasts for the upcoming growing season.
For this growing season, if you think weather conditions will be more favorable for corn this year than in past years, stay about in the middle to the upper part of the range of seeding rates in the table below. If not, and you expect dry subsoils, you might want to consider going towards the lower end of the range of recommended seeding rates, with the warning that if growing conditions improve, you will have limited your top-end yield potential.
The recommended corn seeding rate and final plant population in the following tables attempt to factor in these types of questions for the typical corn growing environments found in Kansas. Adjust within the recommended ranges depending on the specific conditions you expect to face and the hybrid you plan to use. Consult your seed dealer to determine if seeding rates for specific hybrids should be at the lower or upper end of the recommended ranges for a given environment.
Table 1. Suggested dryland corn seeding rates and target plant populations for six cropping regions in Kansas.
|
Region |
Seeding Rate |
Target Plant Population |
|
Northwest |
19,000 – 24,000 |
16,000 – 20,000 |
|
Southwest |
16,000 – 24,000 |
14,000 – 20,000 |
|
North Central |
24,000 – 26,000 |
20,000 – 23,000 |
|
South Central |
21,000 – 26,000 |
18,000 – 22,000 |
|
Northeast |
Medium: 26,000 – 30,000 High: 28,000 – 33,000 |
Medium: 22,000 – 25,000 High: 24,000 – 28,000 |
|
Southeast |
Short Season: 24,000 – 26,000 Full Season: 28,000 – 30,000 |
Short Season: 20,000 – 22,000 Full Season: 24,000 – 26,000 |
Table 2. Suggested irrigated corn final populations and seeding rates.
|
Environment |
Hybrid Maturity |
Final Plant Population (plants per acre) |
Seeding Rate* (seeds per acre) |
|
Full irrigation |
Full-season |
28,000-34,000 |
33,000-40,000 |
|
Shorter-season |
30,000-36,000 |
35,000-42,500 |
|
|
Limited irrigation |
All |
24,000-28,000 |
28,000-33,000 |
* Assumes high germination and that 85 percent of seeds produce plants. Seeding rates can be reduced if field germination is expected to be more than 85%.
K-State research on corn seeding rates
An intensive review of a large database from Corteva Agriscience (2000-2014 period) was utilized to synthesize yield response to plant population under varying yield environments (<100 bu/acre to >200 bu/acre). Overall, yield response to plant population depended on the final yield environment (Figure 2). In yield environments below 100 bu/acre, yield response to plant population was slightly negative. Yield response to plant population tended to be flat when the yield environment ranged from 100 to 150 bu/acre, positive and quadratic with the yield environment improving from 150 to 180 bu/acre, and lastly, increasing almost linearly with increasing plant populations when the yield environment was more than 200 bu/acre (Figure 2).
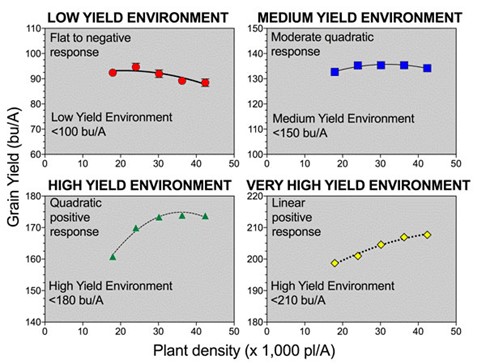
Figure 2. Corn grain yield response to plant density in four yield environments, a) <100; b) 100-150; c) 150-180; and d) > 180-210 bu/acre (Assefa, Ciampitti et al., 2016, Crop Science Journal). Figure created by I.A. Ciampitti, K-State Research and Extension.
As a disclaimer, the “agronomically” optimum plant population does not always match with the “economically” optimal plant population. The final seeding rate depends on the genetics (hybrid), the environment, and other production practices (e.g., planting date, crop rotation, tillage). Also, keep in mind the corn yield response to plant density curves is merely indicative as it represents simplified models that carry uncertainty (error).
Tina Sullivan, Northeast Area Agronomist
tsullivan@ksu.edu
Logan Simon, Southwest Area Agronomist
lsimon@ksu.edu
Lucas Haag, Northwest Area Agronomist
lhaag@ksu.edu