Evapotranspiration (ET) is a measure of how much water is lost by evaporation from the soil surface and transpiration from plants. The Kansas Mesonet, a standardized agriculture-driven weather station network, has historically provided reference ET estimates used for hydrological studies, climate and crop modeling, and irrigation management. In the current drought, irrigation decisions can have critical effects on the underlying aquifers and potential long-term impacts, making ET an extremely valuable Kansas Mesonet output variable. This spring, the Mesonet is updating both how ET is estimated and providing a new tool to access the data.
Previous Data Access
Previously the Kansas Mesonet made ET data available through the historical data page (https://mesonet.k-state.edu/weather/historical/). Evapotranspiration was estimated on a daily basis and users could download up to a year’s worth of daily data.
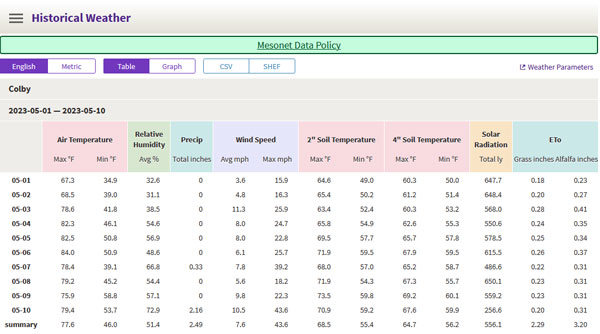
Figure 1. The old method of accessing reference ET data on the Kansas Mesonet.
New Data Web Tool
Over the past year, our team has improved our ET calculations by using higher-resolution weather data to better match field conditions in Kansas. The daily reference ET is no longer calculated and displayed on the historical page. However, this opened new possibilities for a stand-alone ET web tool which can be found at https://mesonet.k-state.edu/agriculture/et/, or via the ≡ menu under “Agriculture” -> “Evapotranspiration”.
This new tool allows users to select a station and time period, view data numerically/graphically, and download data in CSV format (Figure 2). For our oldest stations, data goes back to late 2013.
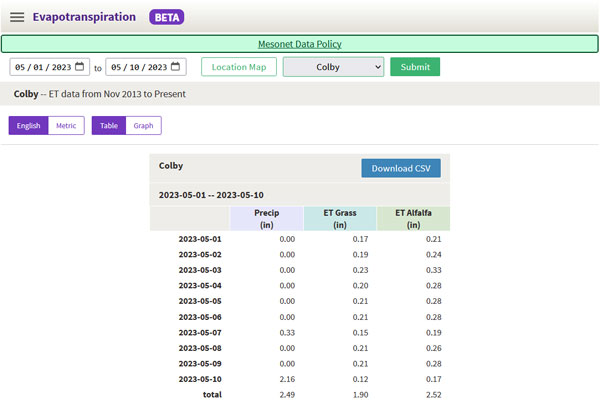
Figure 2. Screenshot of the simple interface of the new ET tool found at https://mesonet.k-state.edu/agriculture/et/.
The new tool also features some significant improvements. Users are no longer limited to 365 days of data. In fact, the new tool allows the comparison of ET and precipitation data for multiple years. In the example below (Figure 3), we changed the starting date for Colby to 2019, so the graphs show the cumulative reference ET for the station for five consecutive years.
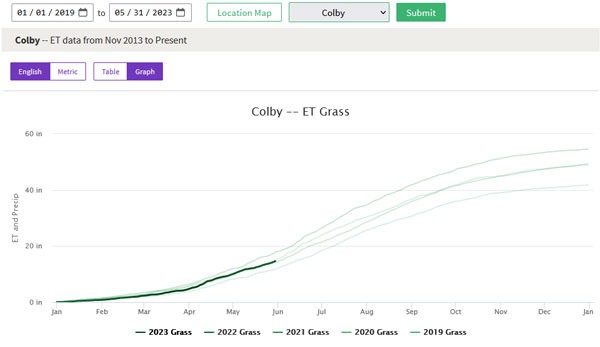
Figure 3. By pulling multiple years' data, users can compare ET to previous years when they select the “Graph” option at the top of the new ET tool: https://mesonet.k-state.edu/agriculture/et/.
ET Calculation Enhancements
For this new product, we have extensively evaluated reference ET calculations. The Kansas Mesonet utilizes the widely accepted reference ET Penman-Monteith equation parameterization provided by the American Society of Civil Engineers (Allen et al. 2005). Previous data availability from our older weather station programs limited us to using daily maximum and minimum temperature and humidity data. We found that this typically resulted in an overestimation of daily ET day in comparison with a preferred calculation using hourly air humidity data.
With a more modern weather station program, we are able to measure temperature and average vapor pressure (instead of humidity) to more accurately measure ET at sub-daily intervals. This gives us higher-resolution daily measurements that capture changes throughout the day. We found this not only provides a better measurement but will also result in lower, more realistic, values in daily reference ET. This improved accuracy results in producers applying less irrigation to sustain crop growth during periods of increased environmental ET demand. For some locations such as Colby, Garden City, and Tribune 6NE, we observed over 10 inches lower growing season ET with the revised calculation compared to what was previously available over the last three years (Table 1). When we consider the need for minimal water use to preserve aquifers, accurate ET estimation is extremely important for producers in western Kansas.
Table 1. Average difference in evapotranspiration with the Mesonet’s modernized equation compared to the previous from 2019-2022. Negative values less estimated overall ET over the growing season (April 1 - September 30) with the revised equation.
|
Weather Station |
ETgrass |
ETalfalfa |
|
Ashland Bottoms |
-3.04 |
-5.53 |
|
Colby |
-6.84 |
-12.09 |
|
Garden City |
-6.85 |
-11.97 |
|
Gypsum |
-4.24 |
-7.65 |
|
Hutchinson 10SW |
-4.78 |
-8.46 |
|
Ottawa 2SE |
-3.17 |
-5.68 |
|
Parsons |
-2.41 |
-4.67 |
|
Scandia |
-3.56 |
-6.35 |
|
Tribune 6NE |
-6.43 |
-11.28 |
The Future
These changes were brought about by feedback from producers. We are striving to provide tools that improve field decisions and hopefully extend our water resources. Through a representative committee across multiple departments, we were able to do the required research and apply these changes to our website. A huge thanks to all those who assisted in this project. If you feel there are additional changes that could be made in the future - please don’t hesitate to reach out to the authors!
Christopher “Chip” Redmond - Kansas Mesonet Manager
christopherredmond@k-state.edu
Dan Regier - Kansas Mesonet Developer
regierdp@k-state.edu
Eduardo Santos - Associate Professor
esantos@k-state.edu
Tags: weather Mesonet tool evapotranspiration