Only a few locations, mostly in far northwest Kansas, have reached the freezing mark thus far in fall 2024. Despite very warm temperatures through the weekend, cooler weather will briefly return early next week. It is likely that more locations, again confined mostly to the northern portion of the state, will approach the 32°F mark. This is a great time to visit the Kansas Mesonet’s Freeze Monitor (https://mesonet.k-state.edu/airtemp/min/hoursbelow/) to compare fall frost/freeze climatology and look at real-time data. The Freeze Monitor is a handy tool to check conditions in your area. Have freezing conditions been recorded? How does it compare to the average? How many hours below freezing was your area?
The average freeze date (32°F) in northwest Kansas is as early as the last week in September (Figure 1). However, southeast Kansas does not usually see freezing temperatures until the end of October. You can find the average first freeze dates by location here: https://mesonet.k-state.edu/airtemp/min/hoursbelow/#tab=table-tab&mtIndex=6. The “Table” tab lists the average dates on the right side (Figure 2). Average dates for the first occurrence of 28°F temperatures are even later (Figure 3).
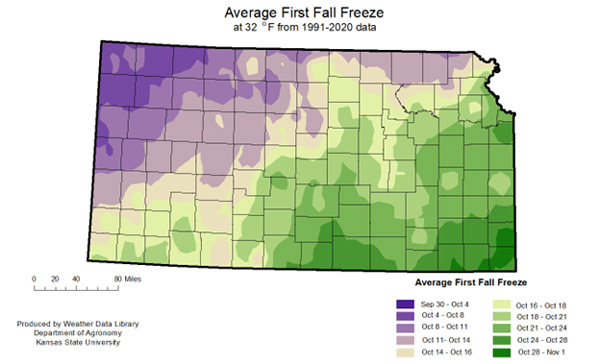
Figure 1. Average fall freeze dates for Kansas. Source: Kansas Weather Data Library.
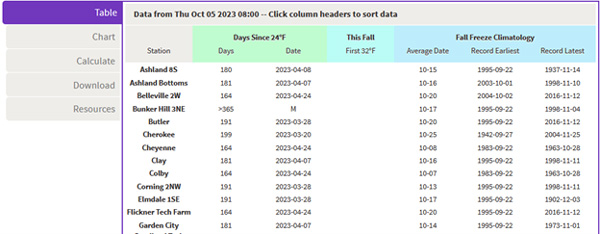
Figure 2. First freeze date averages for all Mesonet stations as found on the “Table” tab. Source: Kansas Mesonet.
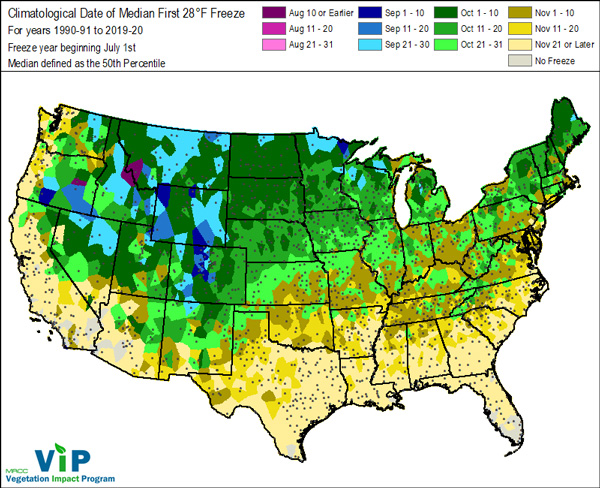
Figure 3. Average 28oF freeze dates for Kansas. Source: Midwest Regional Climate Center.
Historically, almost all parts of the state have recorded freezing temperatures as early as September. The earliest first freeze on record in Kansas was September 3, 1974, when many stations dropped below freezing. This year, with the forecasted near-freezing temperatures on the 7-8th of October, this would be almost exactly average for portions of the northwest and north-central.
Common question: “How cold did it get?”
The Freeze Monitor tool displays the coldest temperatures observed across Kansas during the previous two weeks (the most recent freeze event during the previous two weeks is displayed; Figure 4). It also tracks the first fall freeze date for each station for comparison to local climatology in a table (https://mesonet.k-state.edu/airtemp/min/hoursbelow/#tab=table-tab&mtIndex=6) as seen in Figure 2. Data updates every twenty minutes on both the map and the table.
Common question: “Was it cold long enough to damage crops?”
Another tool important for producers and gardeners is the duration below freezing, as some crops and commodities have lower thresholds for damage. This feature allows users to select options to view maps/data of the “hours below 32°F”, “hours below 24°F,” and the “hours below 12°F”). While all three are of interest, the lower two thresholds are of great importance to wheat growers later into the fall/winter season.
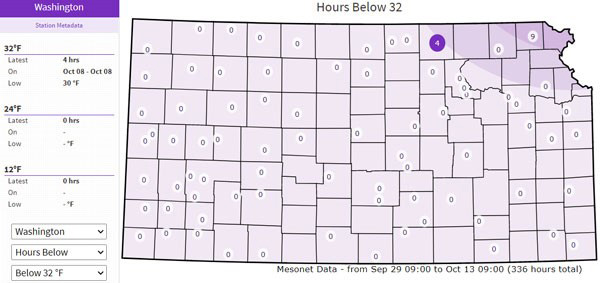
Figure 4. View of the Freeze Monitor webpage on October 13, 2022. Washington (selected station) shows a freeze event on October 8, 2022. The map represents the latest freeze events at these locations since September 29, 2022. Source: https://mesonet.k-state.edu/airtemp/min/hoursbelow/#tab=table-tab&mtIndex=0
Common question: “How long has it been above freezing?”
The freeze monitor can also track the duration of days since the last freeze or below the 24°F and 12°F threshold. This is great for the first freeze and determining the length of the growing season. You can find “days since” using this link: https://mesonet.k-state.edu/airtemp/min/hoursbelow/#tab=table-tab&mtIndex=6. Much of the state hasn’t seen a freeze since late April in the state of Kansas – a growing season between 150-160 days for 2023 (Figure 5).
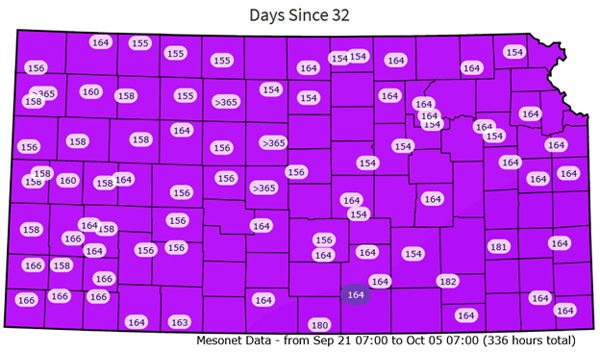
Figure 5. Number of days since the last freeze as of October 5, 2023. Find this information here: https://mesonet.k-state.edu/airtemp/min/hoursbelow/#tab=table-tab&mtIndex=6.
The data displayed in the tables below the maps can be sorted. Clicking on the header of a particular column will sort the table by that column. This makes it much easier to see what area was the coldest in the state, as well as the earliest freeze and earliest climatological freeze data. There are several download options, including table and chart data and images of the maps.
The Freeze Monitor is operational through the winter and available for the 24°F and 12°F thresholds in addition to 32°F. As we near spring, the Freeze Monitor will be updated to present the spring freeze climatology.
Chip Redmond, Weather Data Library/Mesonet
christopherredmond@ksu.edu
Dan Regier, Weather Data Library/Mesonet
regierdp@ksu.edu