Temperature Summary
After a five-day run of above-normal temperatures across the state, a return to below-normal temperatures began on the 17th. All seven days averaged below normal based on data from the Kansas Mesonet. Daytime highs averaged in the 80s all seven days, with highs averaging the warmest on the 19th and 23rd at 88°F (Table 1). Highs on the 20th averaged only 82° or 10 degrees below normal. The Overbrook Mesonet site in Osage County had a high that day of only 69°, and the Konza Prairie site in Riley County only made it to 70°. Normal highs for the period are in the low 90s. The week’s warmest temperature was recorded at Webster Dam in Rooks County on the 19th at 98°. Average morning lows ranged from 59° to 65° during the period, with the lows on the 22nd averaging the coolest. Normal lows for this period are in the upper 60s. The Decatur County Mesonet site northeast of Oberlin registered the week’s coolest temperature on the morning of the 23rd at 52°. This was 12 degrees below the normal low for the date at Oberlin of 64°.
Table 1. Average daily high and low temperatures across the Kansas Mesonet during the 7-day report period. Maximums and minimums listed are the highest and lowest recorded in the state that day.
|
|
Wed Jul 17 |
Thu Jul 18 |
Fri Jul 19 |
Sat Jul 20 |
Sun Jul 21 |
Mon Jul 22 |
Tue Jul 23 |
||||||||
|
Avg High |
87° |
86° |
88° |
81° |
82° |
84° |
88° |
||||||||
|
Max |
Min |
91° |
82° |
89° |
78° |
94° |
80° |
89° |
69° |
86° |
77° |
89° |
81° |
92° |
83° |
|
Normals |
92° |
67° |
92° |
67° |
92° |
67° |
92° |
67° |
92° |
67° |
92° |
67° |
92° |
67° |
|
|
Avg Low |
65° |
62° |
62° |
63° |
61° |
59° |
60° |
||||||||
|
Max |
Min |
72° |
59° |
67° |
55° |
67° |
55° |
67° |
53° |
67° |
57° |
65° |
56° |
69° |
52° |
The 7-day average temperature across Kansas was 73.8° or 5.7° below normal. All divisions were below normal, with departures ranging from -6.8° in the northeast to -3.9° in northwest Kansas. There was an average of 161 growing degree days across the state (based on Kansas Mesonet data) which is 22 below normal. Divisional totals ranged from 151 in northeast Kansas to 173 in south central Kansas. Departures ranged from -34 in east central to -14 in northwest, west central, and southwest Kansas. For the growing season to date, which began on April 1, there has been an average of 2108 growing degree days in Kansas or 98 above normal. Departures for the growing season range from +87 in north central to +150 in south central Kansas. There was an average of 9 corn stress degree days across the state. This is well below the average of 58 for the period. The average for the state since April 1 is 271, which is 18 below the normal amount of 289 for the growing season to date. Southwest Kansas has the highest average at 353, while northeast Kansas’ average is lowest at 130.
Precipitation and Severe Weather Summary
Precipitation early in the period favored southern Kansas. Rainfall totals reported by CoCoRaHS observers for the 24-hour period ending at 7 AM on the 17th exceeded two inches in five counties: Hamilton, Finney, Clark, Barber, and Sumner. When combined with additional rainfall the following day, two-day totals in Hamilton County were as high as 4.05” northeast of Syracuse. The Colby area received heavy rain on the 20th; all nine CoCoRaHS reporters in Thomas County reported at least an inch of rain. The 1.72” reported by the co-operative observer near Colby was the highest 1-day amount there since May 11, 2023. Not all areas picked up significant rainfall during the period. Locations picking up less than one-quarter of an inch for the week include Salina (0.02”), Chanute (0.02”), Emporia (0.06”), Wichita (0.10”), Garden City (0.11”) and Topeka (0.12”).
There were no reports of tornadoes during the period. There were 21 reports of severe wind gusts 58 mph or higher. No reports were at or above hurricane force (74 mph); the highest gust was 70 mph, measured by the Mesonet tower in Norton County on the 19th. There were three reports of severe hail 1” or greater in diameter during the period. The largest report was 1.75” in Logan County on the 19th.
The statewide average precipitation for the 7 days was 0.77”, or 87% of the weekly normal amount of 0.89” (Figure 1). Five divisions were above normal for the week, led by southwest Kansas, which had the highest total (1.24”), closely followed by west central Kansas (1.19”). The two lowest totals for the week were in east central (0.29”) and central (0.30”) Kansas. Since April 1st, the average precipitation across Kansas is 13.47”, or 92% of the normal amount of 14.62”, a departure from normal of -1.25”. Three divisions are above normal for the growing season: northeast, east central and southwest Kansas. Central Kansas is the most below normal (-4.21”) while northeast Kansas is the most above normal (+2.30”) division. Since January 1st, the average statewide precipitation is 16.74”. This amount is 91% of normal, or a departure of –1.63”. Four divisions are above normal for the year to date. Northeast Kansas is the most above normal (+1.79”) but southwest Kansas has the highest percent of normal (111%). Of the five divisions below normal for the year, central Kansas has both the lowest percent of normal (73%) and the largest deficit (-4.79”). South central is the next driest division for the year (86%, -2.56”).
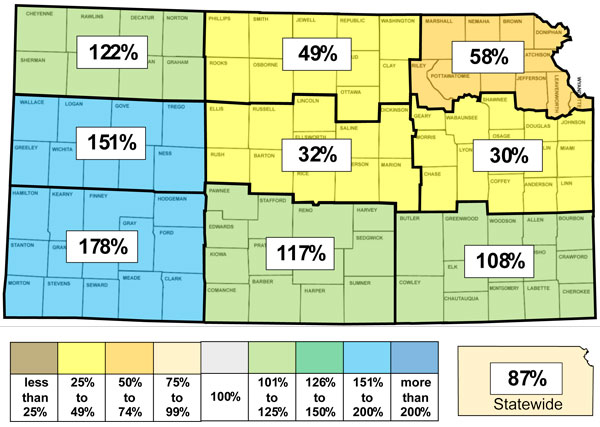
Figure 1. Percent of normal precipitation for the week of July 17-23 for each Kansas climate division. Source: Midwest Regional Climate Center
The average evapotranspiration for grass across the state (based on Kansas Mesonet data) for the week was 1.33”. This is 0.35” below the 10-year normal of 1.68” for the period. Divisional averages ranged from 1.17” in east central to 1.46” in south central Kansas. The statewide average 2” soil temperature across the Kansas Mesonet for the period was 78.6°, a decrease of 2.8° from last week. This average is 2.9° below normal.
Drought Status
This week’s US Drought Monitor update made one-category improvements to parts of five counties along the Colorado border: Cheyenne, Sherman, Hamilton, Stanton, and Morton. Most adjustments in the state this week were degradations. Parts of 30 counties were degraded by one category, primarily in northwest, north central, and central Kansas. Towns where conditions worsened by one category include Hoxie, WaKeeney, Concordia, Clay Center, and McPherson. The percentage of Kansas in drought-free status fell from 47.5% to 41.9% (Figure 2). The statewide Drought Severity and Coverage Index (DSCI) rose 6 points to 81. The percentage of Kansas in D2 or worse drought status remains at 4 percent.
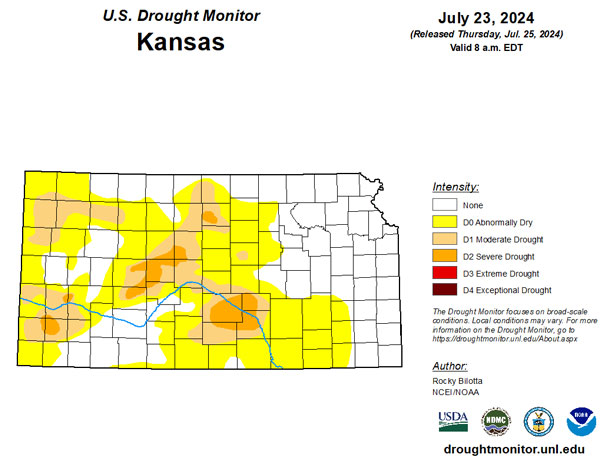
Figure 2. Current drought status for Kansas for the period ending on July 23, 2024.
Weather Forecast
The Weather Prediction Center’s 7-day precipitation forecast, valid for July 24 to July 30, calls for little to no precipitation for most areas (Figure 3). As much as half an inch of rain is possible in the Kansas City metropolitan area. Temperatures during the period are expected to average slightly above normal. The average daily high and low across Kansas for this period are 92° and 67°. Average 7-day precipitation is 0.81” in western Kansas and 0.92” in central and eastern Kansas. The 8 to 14-day outlook, valid for July 31 through August 6, highly favors above-normal temperatures statewide, with the probability of above-normal temperatures ranging from a low of 66% in the far southeast to 80% in northwest Kansas (Figure 4). Highs over 100 degrees will be possible in many areas during this period. Below-normal precipitation is also favored, with probabilities ranging from 38 to 46 percent, highest in far southwestern Kansas and lowest along the Missouri border. The combination of these forecasts raises concerns about the rapid development of drought conditions (flash drought) in the drier parts of the state. Looking further ahead, the outlook for the 14 days from August 3 to August 16 says above-normal temperatures will likely continue over most of the state, with increasing probabilities from east to west (Figure 5). There are equal chances of above and below-normal precipitation for nearly the entire state, with slightly elevated chances for below-normal precipitation in far northwestern Kansas.
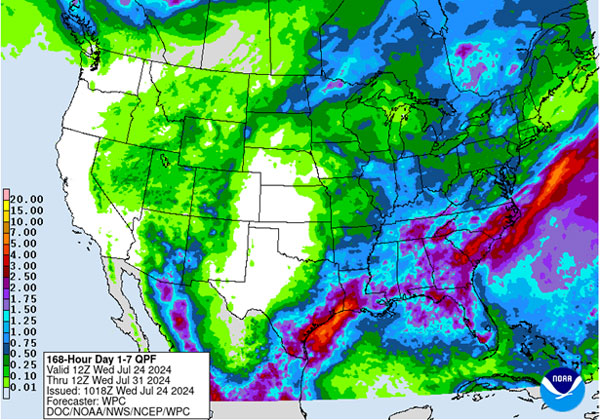
Figure 3. The National Weather Service Weather Prediction Center's 7-day precipitation forecast.
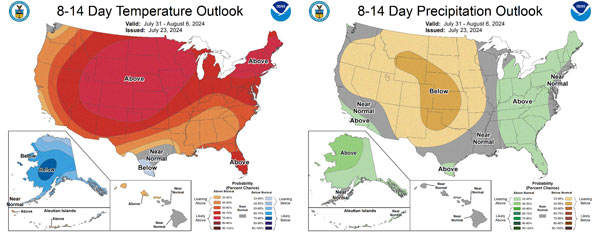
Figure 4. The Climate Predictions Center's 8 to 14-day outlooks (August 3-16, 2024).
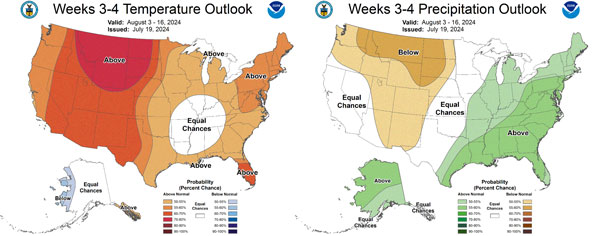
Figure 5. The Climate Prediction Center's weeks 3 and 4 outlooks for temperature and precipitation.
Matthew Sittel, Assistant State Climatologist
msittel@ksu.edu