April 1 has traditionally marked the beginning of the growing season in Kansas. It’s certainly convenient to pick the first day of a month to begin seasonal tracking of precipitation and degree days, but it is not guaranteed that planting on that exact date is risk-free, as April is still subject to freezing temperatures. Take this week, for example. Temperatures were in the 20s in northwest Kansas on the morning of the 3rd. The Cheyenne County Mesonet was the coldest spot, with a chilly 21°F reading. Winter-like as this sounds, it’s not all that unusual this far into spring. Goodland’s normal low for April 3 is still below freezing at 31 degrees. This report explores the chances of a freeze after April 1 across all of Kansas.
The National Centers for Environmental Information (NCEI) have calculated average daily high and low temperatures for thousands of locations across the US. These averages, based on the period 1991-2020, can be used to calculate the probability of a freeze for any location on any given day. Here in Kansas, there are 165 available sites with daily normals. We will look at only 27 of these sites, three in each of Kansas’ nine climate divisions (Table 1).
Table 1. Probabilities of a freeze (a minimum temperature of 32° or less) occurring at selected Kansas locations on or after the given dates, based on 1991-2020 NCEI daily climate normals.
|
Region |
Location |
Apr 5 |
Apr 10 |
Apr 15 |
Apr 20 |
Apr 25 |
Apr 30 |
May 5 |
May 10 |
May 15 |
|
Northwest |
Goodland |
>99% |
>99% |
>99% |
99% |
94% |
80% |
57% |
33% |
15% |
|
Hill City |
>99% |
>99% |
98% |
91% |
76% |
54% |
32% |
16% |
7% |
|
|
Oberlin |
>99% |
>99% |
>99% |
98% |
91% |
76% |
54% |
32% |
16% |
|
|
North Central |
Beloit |
99% |
95% |
84% |
66% |
45% |
27% |
14% |
6% |
2% |
|
Phillipsburg |
>99% |
>99% |
98% |
90% |
73% |
48% |
26% |
12% |
4% |
|
|
Washington |
>99% |
99% |
95% |
84% |
64% |
41% |
23% |
11% |
5% |
|
|
Northeast |
Holton |
>99% |
98% |
93% |
80% |
62% |
42% |
26% |
14% |
6% |
|
Manhattan |
98% |
93% |
81% |
62% |
41% |
24% |
13% |
6% |
2% |
|
|
Troy |
99% |
95% |
84% |
67% |
46% |
29% |
16% |
8% |
3% |
|
|
West Central |
Scott City |
>99% |
>99% |
>99% |
97% |
89% |
70% |
45% |
24% |
10% |
|
WaKeeney |
>99% |
99% |
96% |
87% |
68% |
44% |
23% |
10% |
4% |
|
|
Wallace |
>99% |
>99% |
>99% |
99% |
93% |
79% |
55% |
30% |
13% |
|
|
Central |
Ellsworth |
>99% |
99% |
96% |
86% |
67% |
43% |
23% |
10% |
4% |
|
Hays |
99% |
97% |
91% |
78% |
57% |
35% |
17% |
6% |
2% |
|
|
Marion |
88% |
74% |
55% |
35% |
19% |
9% |
4% |
1% |
<1% |
|
|
East Central |
Emporia |
93% |
81% |
63% |
42% |
24% |
12% |
5% |
2% |
1% |
|
Olathe |
87% |
72% |
52% |
32% |
17% |
8% |
3% |
1% |
<1% |
|
|
Topeka |
93% |
82% |
64% |
44% |
27% |
14% |
7% |
3% |
1% |
|
|
Southwest |
Dodge City |
99% |
97% |
89% |
74% |
53% |
31% |
16% |
7% |
2% |
|
Garden City |
>99% |
99% |
97% |
89% |
72% |
47% |
26% |
12% |
4% |
|
|
Hugoton |
99% |
96% |
87% |
69% |
45% |
22% |
9% |
3% |
1% |
|
|
South Central |
Larned |
99% |
95% |
85% |
67% |
44% |
23% |
10% |
4% |
1% |
|
Medicine Lodge |
92% |
82% |
67% |
48% |
30% |
16% |
8% |
3% |
1% |
|
|
Wichita |
87% |
74% |
57% |
39% |
23% |
11% |
4% |
1% |
<1% |
|
|
Southeast |
Coffeyville |
81% |
65% |
46% |
29% |
16% |
7% |
3% |
1% |
<1% |
|
Eureka |
98% |
93% |
81% |
62% |
40% |
22% |
10% |
4% |
1% |
|
|
Fort Scott |
87% |
71% |
51% |
31% |
16% |
8% |
4% |
2% |
1% |
An explanation of the contents of Table 1 is in order. Let’s take a look at the row for Manhattan. In the column headed by Apr 10, we see 93%. This percentage is the chance of a freeze on or after the given date. For this example, there is a 93% chance of a freeze occurring on or after April 10 in Manhattan. Two columns to the right show a lower chance, 62%, of a freeze on or after April 20. By the end of April, the chance of a freeze is only 24%, and on or after May 10th, it drops to 6%.
After the first of April, a freeze is still likely to occur statewide. There is still an 80% chance of a freeze on or after April 30 in Goodland, but just an 8% chance in both Olathe and Fort Scott. On or after May 15, the risk of a freeze is under 10% except in parts of northwest and west central Kansas. The 7-day statewide average soil temperature at 2” typically reaches 50° or greater for the first time on March 31, so one could plant certain crops on April 1 but do so with a high risk of a freeze. If one waits too long to plant, an early freeze in the fall may cut the growing season short before a crop is ready to be harvested. Location is also an important consideration; an early planting date is much later in spring in the northwest than it is in the southeast.
It is worth noting that a low of 32° may not cause any damage to tender vegetation if the duration of freezing temperatures is short-lived. A low of 28° implies a longer period of freezing temperatures that is more likely to damage young plants. A low of 36° suggests frost may form, which could cause damage even if a freeze doesn’t occur. If we take a look at the probabilities of temperatures falling to each of these three temperatures, we can get a better idea of the risk of frost (36° or colder), a freeze (32° or colder), and a hard freeze (28° or colder). Table 2 contains the probabilities of these three events for the same nine dates in Table 1. But rather than individual locations, the table contains average dates across all the locations within each climate division. There is a greater than 90% chance of a frost on or after April 15 across the entire state. A freeze is likely in all divisions, but the chances of a killing freeze are less than 50% in eastern Kansas but 90% in northwest Kansas. There is an 80% or better chance of a frost in western Kansas on or after April 30th, and in northwest Kansas, there is still a 42% chance of a frost on or after May 15.
Table 2. Probabilities of minimum temperatures at or below 36°, 32° and 28° across each of the nine Kansas climate divisions on or after the given dates, based on 1991-2020 NCEI daily climate normals.
|
Region |
Threshold |
Apr 5 |
Apr 10 |
Apr 15 |
Apr 20 |
Apr 25 |
Apr 30 |
May 5 |
May 10 |
May 15 |
|
Northwest |
36° |
>99% |
>99% |
>99% |
>99% |
>99% |
97% |
88% |
67% |
42% |
|
32° |
>99% |
>99% |
>99% |
98% |
90% |
73% |
49% |
28% |
13% |
|
|
28° |
99% |
97% |
90% |
76% |
54% |
33% |
17% |
7% |
3% |
|
|
North Central |
36° |
>99% |
>99% |
>99% |
99% |
94% |
80% |
58% |
34% |
16% |
|
32° |
>99% |
99% |
95% |
85% |
65% |
42% |
23% |
10% |
4% |
|
|
28° |
96% |
87% |
70% |
49% |
29% |
14% |
6% |
2% |
1% |
|
|
Northeast |
36° |
>99% |
>99% |
98% |
92% |
78% |
58% |
37% |
20% |
9% |
|
32° |
98% |
94% |
82% |
63% |
42% |
24% |
12% |
5% |
2% |
|
|
28° |
85% |
69% |
48% |
29% |
15% |
7% |
3% |
1% |
<1% |
|
|
West Central |
36° |
>99% |
>99% |
>99% |
>99% |
99% |
96% |
83% |
59% |
33% |
|
32° |
>99% |
>99% |
99% |
97% |
87% |
67% |
42% |
21% |
9% |
|
|
28° |
99% |
96% |
87% |
71% |
48% |
27% |
13% |
5% |
2% |
|
|
Central |
36° |
>99% |
>99% |
>99% |
97% |
89% |
72% |
49% |
28% |
13% |
|
32° |
99% |
97% |
91% |
77% |
57% |
35% |
18% |
8% |
3% |
|
|
28° |
91% |
79% |
61% |
42% |
24% |
12% |
5% |
2% |
1% |
|
|
East Central |
36° |
>99% |
99% |
95% |
85% |
67% |
45% |
26% |
13% |
5% |
|
32° |
96% |
88% |
72% |
51% |
31% |
16% |
7% |
3% |
1% |
|
|
28° |
76% |
57% |
37% |
20% |
10% |
4% |
2% |
1% |
<1% |
|
|
Southwest |
36° |
>99% |
>99% |
>99% |
99% |
94% |
80% |
55% |
31% |
14% |
|
32° |
>99% |
99% |
95% |
83% |
62% |
38% |
19% |
8% |
3% |
|
|
28° |
93% |
83% |
65% |
44% |
24% |
11% |
4% |
1% |
<1% |
|
|
South Central |
36° |
>99% |
>99% |
97% |
90% |
74% |
52% |
30% |
15% |
6% |
|
32° |
97% |
91% |
78% |
59% |
37% |
20% |
9% |
3% |
1% |
|
|
28° |
79% |
62% |
42% |
25% |
13% |
5% |
2% |
1% |
<1% |
|
|
Southeast |
36° |
>99% |
97% |
91% |
76% |
56% |
35% |
19% |
9% |
3% |
|
32° |
92% |
79% |
61% |
41% |
23% |
11% |
5% |
2% |
1% |
|
|
28° |
65% |
46% |
28% |
15% |
7% |
3% |
1% |
<1% |
<1% |
It is important to remember that these dates are based on 30-year averages. Conditions vary from year to year, and short-term and medium-range forecasts provide useful information on the likelihood of damaging cold conditions in any given spring. What about this year? Soil temperatures are running about 5 degrees above normal right now, with 7-day averages mostly in the 50s (Figure 1).
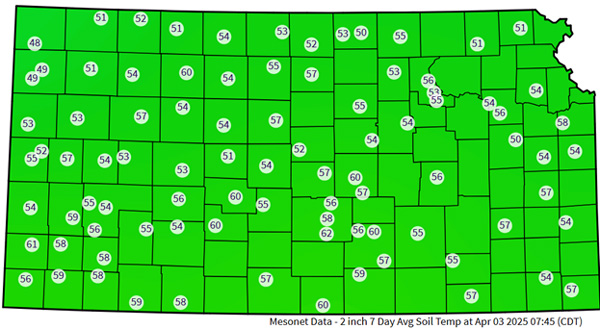
Figure 1. Seven-day average soil temperatures across Kansas at the 2” depth, for the period March 27-April 3. Source: Kansas Mesonet (https://mesonet.k-state.edu).
The forecast for this weekend calls for frost and freezing conditions across much of the state, particularly on Sunday morning when lows in the 20s are forecast for all of western Kansas. Conditions can change quickly this time of year, with rapid swings from warm to cold. We had a few Mesonet sites reach the 90-degree mark on March 27 and 28, yet here we are talking about freezing conditions again a week later. When considering the right time to plant, monitoring forecasts is a must, especially right now. The best advice for now is to proceed cautiously and keep an eye on the forecast for any signs of colder weather in the coming weeks.
You can monitor soil temperatures across the state by visiting the Kansas Mesonet’s web page (https://mesonet.k-state.edu) and selecting “Agriculture” from the drop-down menu. You’ll also find current temperature, wind speed, and precipitation data for 90 stations on the site, along with growing degree day data which will help with decisions related to planting and condition monitoring, both now and during the growing season.
Matthew Sittel, Assistant State Climatologist
msittel@ksu.edu
Tags: weather spring freeze late freeze