Last week, we examined the 2023 growing season compared to 2022 in terms of temperature and precipitation differences. We also touched on how 2023 compares to normal. This week, we take a closer look at the growing season to date and consider additional variables such as evapotranspiration (ET) and degree days. While there are many ways to calculate degree days, for this report we consider the variant specific to corn, where the minimum and maximum temperature thresholds for accruing degree days are 50°F and 86°F, respectively. This version is commonly referred to as growing degree days (GDD).
Table 1. Average temperature, total growing degree days (GDD), total precipitation, total evapotranspiration for grass (ETg), and average 2-meter wind speed from April 1-July 13, 2023. The value in parentheses is the departure from normal for each metric. Temperature, precipitation, and GDD normals are 30-year averages based on 1991-2020 data sourced from the National Centers for Environmental Information (NCEI), while ETg and 2-meter wind speed normals are for the period 2013-2022 and based on hourly Kansas Mesonet observations.
|
Location |
Average Temperature (Departure) |
Growing Degree Days (Departure) |
Total Precipitation (Departure) |
ETg (Departure) |
Average 2m Wind Speed (Departure) |
|
West Divisions |
|||||
|
Colby |
61.7° (-0.8°) |
1512 (-13) |
12.67” (+3.66”) |
18.41” (-2.46”) |
8.4 mph |
|
Tribune |
61.2° (-1.2°) |
1469 (-48) |
11.85” (+4.15”) |
17.66” (-3.49”) |
7.0 mph (-0.4 mph) |
|
Wallace |
60.9° (-2.5°) |
1462 (-106) |
11.00” (+2.35”) |
18.57” (-3.05”) |
9.4 mph (+1.8 mph) |
|
Garden City |
64.1° (-1.1°) |
1665 (-32) |
13.43” (+4.66”) |
18.66” (-3.75”) |
7.7 mph (+0.2 mph) |
|
Stanton |
63.4° (-2.6°) |
1623 (-105) |
11.48” (+4.81”) |
18.48” (-4.54”) |
7.0 mph (-0.3 mph) |
|
Meade |
65.0° (-0.8°) |
1698 (-31) |
17.14” (+7.43”) |
18.67” (-3.41”) |
6.1 mph (-1.2 mph) |
|
Central Divisions |
|||||
|
Scandia |
65.7° (-1.0°) |
1774 (-30) |
7.51” (-6.45”) |
20.24” (+1.56”) |
6.8 mph (-0.4 mph) |
|
Hays |
65.2° (-0.5°) |
1774 (+56) |
8.06” (-2.21”) |
19.91” (-1.41”) |
8.2 mph (+0.8 mph) |
|
Hutchinson |
66.9° (+0.8°) |
1870 (+106) |
12.21” (-1.12”) |
18.59” (-1.04”) |
6.3 mph (-1.1 mph) |
|
St. John |
66.0° (-1.4°) |
1814 (-28) |
13.35” (+0.56”) |
19.57” (-0.61”) |
6.9 mph (-0.6 mph) |
|
East Divisions |
|||||
|
Manhattan |
67.1° (+0.5°) |
1876 (+62) |
12.01” (-4.09”) |
18.73” (+0.24”) |
5.0 mph (-2.2 mph) |
|
Rossville |
65.7° (-1.6°) |
1803 (-51) |
12.01” (-3.60”) |
17.45” (-0.14”) |
4.9 mph (-2.4 mph) |
|
Miami |
67.6° (+1.1°) |
1923 (+106) |
7.32” (-9.68”) |
17.74” (+1.54”) |
3.6 mph (-3.6 mph) |
|
Butler |
67.4° (+0.1°) |
1915 (+56) |
8.56” (-8.13”) |
17.86” (+1.33”) |
4.4 mph (-2.8 mph) |
|
Cherokee |
68.3° (+1.0°) |
1970 (+114) |
9.80” (-9.46”) |
16.79” (+0.34”) |
3.9 mph (-2.9 mph) |
|
Parsons |
67.6° (+0.6°) |
1902 (+67) |
14.07” (-5.07”) |
16.73” (-0.21”) |
3.6 mph (-3.8 mph) |
|
Sedan |
68.1° (+0.6°) |
1946 (+63) |
9.47” (-8.27”) |
16.53” (+0.17”) |
3.5 mph (-3.8 mph) |
|
Woodson |
67.7° (+1.3°) |
1932 (+138) |
10.45” (-7.37”) |
18.23” (+1.50”) |
6.2 mph (-1.3 mph) |
The math behind the measurements
In order to make these additional comparisons, we need to look at sites where GDD and ET are measured or can be derived from available data. Growing degree days (GDD) are easily determined from maximum and minimum daily temperatures, so any site recording temperatures is also usable to determine GDD. Calculation of evapotranspiration (ET) is more complex and requires knowledge of five different variables: air temperature, barometric pressure, relative humidity, solar radiation, and 2-meter wind speed all available through the Kansas Mesonet. We also expand our range of dates slightly from last week to span the growing season to date: April 1st through July 13th.
An explanation of the normals used in this report is in order. The National Centers for Environmental Information (NCEI) calculated 30-year normals for 1991 to 2020 at over 160 locations across the state. Every Mesonet site has been paired up with its nearest NCEI location to obtain average temperature, total precipitation, and the total number of GDD for the April 1-July 13 period. NCEI does not calculate average ET, so it was necessary to calculate these based on Mesonet data. There are only 12 Mesonet sites with 30 years of data for the same 1991-2020 period, so building a 30-year climatology for ET wasn’t possible for every site. Instead, a 10-year period from 2013 through 2022 was used to generate ET averages at 18 locations found in Table 1. Additional data for stations not listed can be found on the Mesonet’s ET tool.
Growing degree day (GDD) summary
Eight of the 18 locations are currently running below normal for average temperature for the growing season. Since GDDs are a function of temperature, and warmer weather means more GDD, it should come as no surprise that the sign of the departures for average temperature and GDD are the same for all locations with the exception of Hays (Figure 1). With day-to-day variations and large swings in temperatures both within a single day and over longer periods, a difference in signs can occasionally occur. The lowest GDD values were focused in western Kansas which correlates well with above-normal moisture and resulting cooler weather. Of the stations sampled, Wallace had the last GDD in the state with 1462 GDD units (-106 from normal). Eastern Kansas was the opposite, with most stations observing warmer-than-normal temperatures and negative precipitation departures (Figure 1). This has resulted in above normal GDD values with Cherokee recording the least (1970 units, +116 from normal). In terms of the corn life cycle, we are at or beyond the silking stage in most areas, a critical time in the development of mature corn plants. A lack of moisture in this stage can reduce yields.
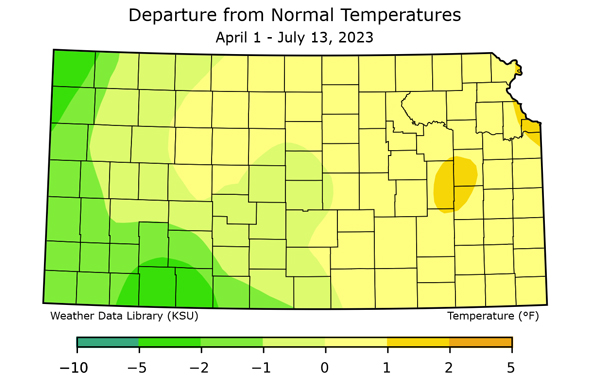
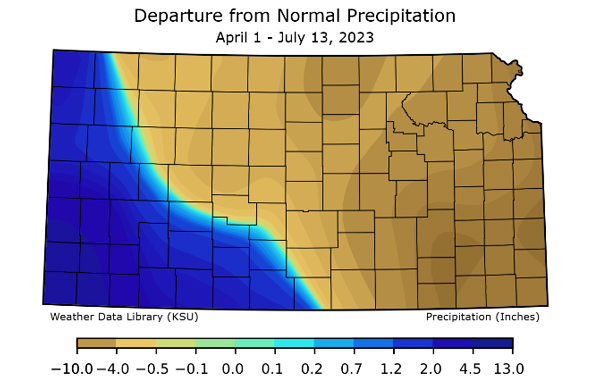
Figure 1. Temperature (top) and precipitation (bottom) departures from normal from April 1 – July 13, 202,3 across Kansas. Source: Kansas Climate Office.
Evapotranspiration (ET) summary
Similar to GDDs, temperature, and precipitation anomalies can greatly impact evapotranspiration (ET) – the movement of moisture from the surface to the atmosphere via vegetation transpiration and evaporation. Let’s start by thinking about precipitation. Rainy days result in increased clouds which reduce solar radiation and temperature while keeping atmospheric moisture higher. This creates less ET demand by the atmosphere and reduces the overall moisture loss from vegetation and evaporation. While this can be good for crop development and reduce drought concerns, it can increase other stresses such as disease and pests. On the flip side, decreased precipitation results in more solar radiation, warmer temperatures, and less overall surface moisture/humidity. This increases atmospheric ET demand and can more readily result in moisture loss – not an anomaly we want to reduce drought or crop stress during critical stages of corn development. Ideally, we would want “normal” values to get the best of both worlds, however, this isn’t a realistic expectation as our climate averages weather extremes.
Evapotranspiration is also dependent on the wind: the higher the wind speed, we would expect larger ET demands. Has it been windier than usual in Kansas this growing season? We calculated the average 2-meter wind speed for the same 2013-2022 period that we used for average ET, as well as for this year, to fill in the last column in Table 1. Only four of the 18 locations have above-average wind speeds this growing season. Three of these were in the West where ET was the lowest in the state, contradictory to what we would expect. Average winds are typically the weakest in the summer months (Figure 2). Major storm systems typically shift northward and periods of high pressure result in weaker overall winds. This year, the winds were cooler and associated with thunderstorm activity in the west. Additionally, eastern Kansas observed much less 2023 average wind with Manhattan, Parsons, and Sedan measuring their lowest in the 10-year period. This is the result of more dominant high pressure and less thunderstorm activity despite higher ET atmospheric demands.
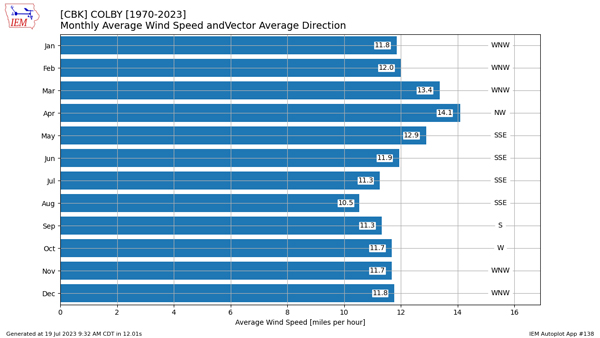
Figure 2. Average monthly wind speeds by month (at 10m which is typically higher than our average 2m winds on the Mesonet). Source: IEM.
Overall, ET is below normal at 11 of the 18 locations in Table 1. For 15 of the 18 locations, the sign of the temperature departure is the same as the ET departure (e.g., above/below normal temperatures paired with above/below normal ET). For 14 of the 18 locations, the sign of the precipitation departure is opposite that for ET (e.g., above/below normal precipitation paired with below/above normal ET). The areas of most concern are those where precipitation is below normal and ET is above normal. There are seven such locations, all in the eastern half of the state. Of these seven, the Miami County site is worst off, with a precipitation deficit of over 9.6 inches and ET running over 1.5 inches above normal. This is an area where drought conditions have worsened. Most of Miami County has fallen from D0 to D2 drought status in the past month (Source: US Drought Monitor).
Mid-July is when average high temperatures are near their maximum, and it’s also the time of year when excessive heat and a lack of moisture can prove a devastating combination for crops. Precipitation is already lacking for many, let’s hope extreme heat (which we really haven’t seen this year) stays away and that precipitation is plentiful in drought-stricken areas in the coming weeks.
You can easily track growing degree days and evapotranspiration for your area by visiting the following links on the Kansas Mesonet webpage:
Growing Degree Days: http://mesonet.k-state.edu/agriculture/degreedays/
Evapotranspiration: http://mesonet.k-state.edu/agriculture/et/
Matthew Sittel, Assistant State Climatologist
msittel@ksu.edu
Christopher “Chip” Redmond, Kansas Mesonet Manager
christopherredmond@ksu.edu
Tags: weather Mesonet growing degree days evapotranspiration