Adequate moisture is a must for crops and ultimately yield. Problems arise when too much or too little precipitation falls. Unfortunately, the nature of climate is the average of extremes on the high and low end of the spectrum. Additionally, geography favors more moisture for eastern Kansas, with a decrease in averages with western extent. This year, we have a drought situation across much of the state. This article will provide some historical perspective of 2022 precipitation thus far.
Rainfall period: April 1 to July 20, 2022
The dataset for this report consists of precipitation received at 36 different locations across Kansas from the period April 1-July 20, 2022 (Table 1), which we will refer to herein as the “growing season” to date. For inclusion, a site must have at least 50 years of data, and each year must have no more than 7 missing records. Four sites were selected from each of Kansas’ nine climate regions (Figure 1) to give equal representation across all areas of the state. The rank listed for each city is calculated by sorting each site’s precipitation totals for the same period in ascending order, from driest to wettest. The driest of all years ranks 1st, the next driest 2nd, and so forth. But, since each site has been around for a different number of years, evaluating sites by ranks doesn’t fairly compare them. A better way to compare sites with different periods of record is to sort by percentiles.
Table 1. Total precipitation from April 1-July 20, 2022, in order of increasing percentile.
|
Site |
County |
Climate Division |
Precip. (in.) |
Rank |
Years |
Percentile |
|
Healy |
Lane |
KS04 |
2.64 |
1 |
122 |
1 |
|
Garden City |
Finney |
KS07 |
1.89 |
1 |
70 |
1 |
|
Russell Springs |
Logan |
KS04 |
3.96 |
3 |
75 |
4 |
|
Tribune |
Greeley |
KS04 |
3.60 |
5 |
113 |
4 |
|
WaKeeney |
Trego |
KS04 |
5.35 |
5 |
112 |
4 |
|
Dodge City |
Ford |
KS07 |
4.28 |
5 |
109 |
5 |
|
Colby |
Thomas |
KS01 |
5.10 |
5 |
68 |
7 |
|
Hill City |
Graham |
KS01 |
5.18 |
7 |
89 |
8 |
|
Ashland |
Clark |
KS07 |
5.83 |
10 |
123 |
8 |
|
Atwood |
Rawlins |
KS01 |
6.03 |
9 |
96 |
9 |
|
Goodland |
Sherman |
KS01 |
5.35 |
16 |
109 |
15 |
|
Beloit |
Mitchell |
KS02 |
9.73 |
28 |
108 |
26 |
|
Russell |
Russell |
KS05 |
8.57 |
19 |
71 |
27 |
|
Smith Center |
Smith |
KS02 |
8.96 |
30 |
107 |
28 |
|
Hugoton |
Stevens |
KS07 |
7.38 |
33 |
107 |
31 |
|
Greensburg |
Kiowa |
KS08 |
9.05 |
35 |
105 |
33 |
|
Holton |
Jackson |
KS03 |
14.09 |
35 |
101 |
35 |
|
Chanute |
Neosho |
KS09 |
16.04 |
46 |
111 |
41 |
|
Concordia |
Cloud |
KS02 |
11.64 |
63 |
137 |
46 |
|
Atchison |
Atchison |
KS03 |
15.61 |
59 |
116 |
51 |
|
Clay Center |
Clay |
KS02 |
13.59 |
60 |
114 |
53 |
|
Emporia |
Lyon |
KS06 |
16.66 |
29 |
52 |
56 |
|
Lawrence |
Douglas |
KS06 |
16.96 |
73 |
122 |
60 |
|
Topeka |
Shawnee |
KS06 |
16.29 |
47 |
76 |
62 |
|
Arkansas City |
Cowley |
KS09 |
16.83 |
49 |
79 |
62 |
|
McPherson |
McPherson |
KS05 |
15.28 |
84 |
126 |
67 |
|
Wellington |
Sumner |
KS08 |
18.38 |
78 |
109 |
72 |
|
Osage City |
Osage |
KS06 |
19.13 |
72 |
99 |
73 |
|
Parsons |
Labette |
KS09 |
22.90 |
73 |
97 |
75 |
|
Manhattan |
Riley |
KS03 |
19.05 |
98 |
126 |
78 |
|
Wichita |
Sedgwick |
KS08 |
18.58 |
55 |
69 |
80 |
|
Newton |
Harvey |
KS08 |
18.64 |
96 |
119 |
81 |
|
Salina |
Saline |
KS05 |
16.41 |
53 |
65 |
82 |
|
Marysville |
Marshall |
KS03 |
17.93 |
63 |
75 |
84 |
|
Fort Scott |
Bourbon |
KS09 |
22.87 |
95 |
113 |
84 |
|
Abilene |
Dickinson |
KS05 |
19.04 |
89 |
99 |
90 |
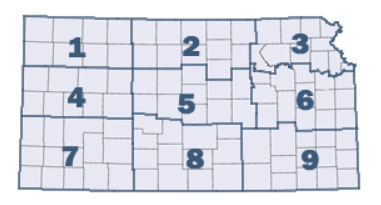
Figure 1. Map of Kansas Climate Divisions.
A quick example to clarify the interpretation of percentiles is in order. For example, at Manhattan, precipitation for the growing season this year ranks as the 98th driest out of 126 years. The listed percentile, 78, means that 78% of the 126 years on record at Manhattan are drier than 2022 for the growing season. A percentile of 50 indicates the median, or middle, value out of all seasons. Percentiles less than 50 indicate drier years than the median, and those above 50 are wetter years.
The lack of precipitation in the western third of Kansas is clearly evident in the data. Eleven of the twelve lowest percentiles are in western Kansas, with Healy and Garden City the most extreme, as both of their growing seasons rank as the driest on record! Looking at Garden City since the beginning of the year, it remains the driest on record (Figure 2). Colby, Dodge City, and Hill City are just three of the locations experiencing one of their 10 driest growing seasons. Central and eastern Kansas have had more precipitation, and most of those sites have above median precipitation, with a few exceptions. As we know, a stray thunderstorm can drop a lot of rain in one county and miss the next one, so there is variation in percentiles even within the same climate division. Wichita, Salina, and Manhattan have all had copious amounts of precipitation this spring, but it’s Abilene that has the highest percentile currently of 90. Only ten percent of the years on record in Abilene have had more precipitation.
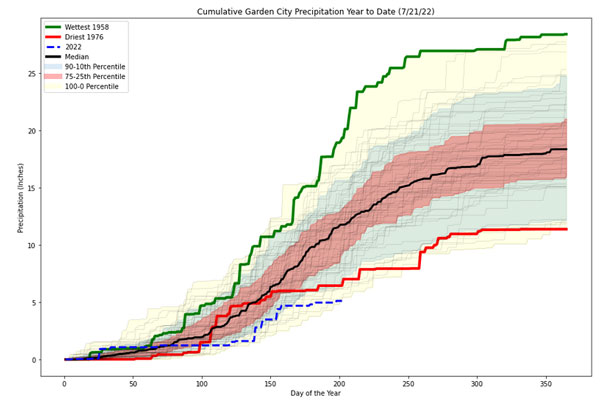
Figure 2. Garden City accumulated precipitation since January 1st showing the driest on record as of July 20, 2022.
As we move into late summer, it will be interesting to see how this year will stack up compared to previous years across the state. One thing is for certain: western Kansas desperately needs moisture. Driest on record, while climatologically significant, is potentially devastating to agriculture interests in Kansas. Here’s hoping things change for the better soon.
Matthew Sittel, Assistant State Climatologist
msittel@ksu.edu
Christopher “Chip” Redmond, Kansas Mesonet Manager
christopherredmond@k-state.edu
Tags: weather Climate precipitation