September and October weather
The first two months of meteorological fall, September and October, have been unseasonably warm. Temperatures for this two-month period in Kansas averaged over 4 degrees above normal, making this the 7th warmest September-October period on record (Fig. 1), dating back to 1895. All nine Kansas climate divisions are experiencing a top 10 warmest fall so far, led by northwest Kansas, where fall 2024 ranks as 2nd warmest, behind only 1963. Goodland finished this period just one-tenth of a degree behind the warmest September-October period on record there, set back in 1938. Their 2-month average temperature of 65.0° was 6.4° above normal. After a brief cold snap in mid-October that brought a first freeze to most of the state, several locations in eastern Kansas have yet to fall below freezing again. Some locations, such as Coffeyville and Girard, still await their first freeze in the southeast. As we approach mid-November, average morning lows have decreased to near freezing in many areas, making the lack of a second freeze even more unusual. Temperatures so far in November are a continuation of mild conditions; through November 13th, the average temperature in the state is running 4.0° above normal.
September and October were also quite dry across the state. The average precipitation across the state for the two months combined was 2.50”, or 2.34” below normal. This ranks as the 9th driest September and October combined in 130 years of weather records. A few locations picked up an inch or less of precipitation during this period, including Russell Springs (0.54”), Goodland (0.70”), Russell (0.84”), Colby (0.87”), and Scott City (0.97”).
November starts with rain and warm temperatures
After an extended period of dry conditions across the state, November has started out very wet, thanks to multiple rounds of heavy rain (Fig. 2). With about half of the month remaining, total precipitation amounts are already high enough to not only ensure a wetter than normal November by month’s end, but also to guarantee a top-10 wettest November in many locations across the state, particularly in western and southern Kansas (Table 1). A couple of locations have already set the record for the wettest November. Goodland’s total of 3.16” beat the previous record of 2.63” for the month set in 1946. Cimarron, in Gray County, has received 3.66” of precipitation so far this month, exceeding the old mark of 3.23” set in 1928. In parts of southeast Kansas, while not the wettest on record, some totals for the month so far are already above 6 inches. The cooperative observer in Chautauqua has already measured 9.20” so far this month, the highest of any reporting site in the state. Other extreme totals include 8.60” in Butler County (El Dorado 7.9 NNW), 8.36” in Montgomery County (Coffeyville 0.8 ESE), 8.34” in Chase County (Wonsevu) and 8.13” in Wilson County (Neodesha 3 NE). Kansas’ current record for wettest November is 13.03” set in the town of Lebo in Coffey County back in 1928. But Chautauqua’s current total is the highest November total anywhere in the state since 1998.
As of November 13, the average statewide precipitation is estimated at 3.77”, which, if it were the average precipitation for the entire month, would rank November 2024 as the 5th wettest in 130 years of record-keeping. But there is still about half the month left to go; there is still plenty of time for totals to increase if more precipitation falls before month’s end. The record for wettest November is 4.68” in 1909, less than an inch above the current estimate. What do the latest outlooks call for in the coming weeks and for winter, which for meteorological purposes begins in just over two weeks on December 1? Could this be a very wet winter?
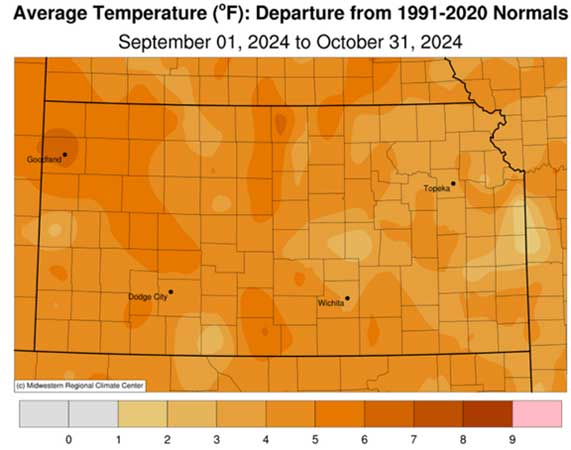
Figure 1: September-October 2024’s average temperature. Source: Midwest Regional Climate Center.
Table 1. Precipitation totals for November 1-13, 2024, for select locations across Kansas, along with comparisons to normal and record monthly precipitation.
|
Location |
County |
Precip. Totals Nov. 1-13 |
Normal Nov. Precip. |
2024 Rank Wettest Nov. |
Record Wettest Nov. (Year) |
|
Cimarron |
Gray |
3.66” |
0.67” |
1 (113) |
3.66” (2024) |
|
Goodland |
Sherman |
3.16” |
0.54” |
1 (117) |
3.16” (2024) |
|
Coldwater |
Comanche |
4.55” |
0.95” |
2 (120) |
7.74” (1909) |
|
Dodge City |
Ford |
4.07” |
0.80” |
2 (151) |
5.81” (1909) |
|
Greensburg |
Kiowa |
5.01” |
0.96” |
2 (114) |
7.80” (1909) |
|
Fredonia |
Wilson |
9.01” |
2.31” |
2 (117) |
10.31” (1931) |
|
Sedan |
Chautauqua |
9.05” |
2.15” |
3 (129) |
11.19” (1931) |
|
Wellington |
Sumner |
5.61” |
1.78” |
3 (111) |
10.74” (1964) |
|
Ulysses |
Grant |
2.86” |
0.49” |
4 (124) |
3.89” (1971) |
|
Wichita |
Sedgwick |
5.78” |
1.36” |
4 (137) |
6.69” (1909) |
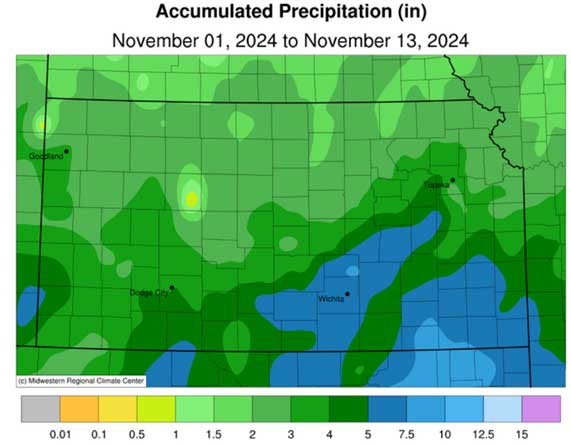
Figure 2: Accumulated precipitation so far in November 2024. Source: Midwest Regional Climate Center.
A time of outlook turmoil
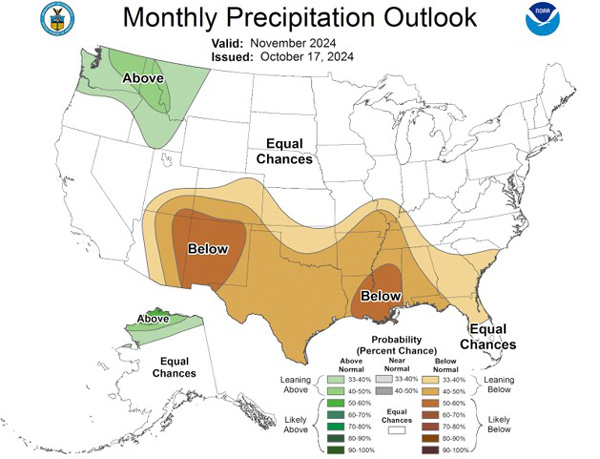
Things have changed at a rapid pace across the Great Plains. The November forecast of equal chances and a favor towards drier than normal for southwest Kansas significantly changed by the end of October (Figure 3). In the next update, a favor toward wetter-than-normal conditions was introduced and increased across most of the central US. The result has been a shift from expected drought expansion to actual drought removal across the region. The origins of this substantial shift are the result of two triggers. First, the storm track has been active from the northwest, which we were expecting with the current Pacific Ocean conditions (negative Pacific Decadal Oscillation (PDO) and neutral to almost La Niña conditions). This meant that central Kansas was “living on the edge.” The region was typically favored towards drier conditions, but the potential was there for a slight storm track shift, resulting in significantly different outcomes. Secondly, the tropics remain very active. Tropics pool moisture, and with an active storm track to the north, this moisture can be pulled northward into the mid-latitudes. The result has been timely precipitation post-harvest and ideal for improving soil moisture and winter wheat stands.
 ––
––
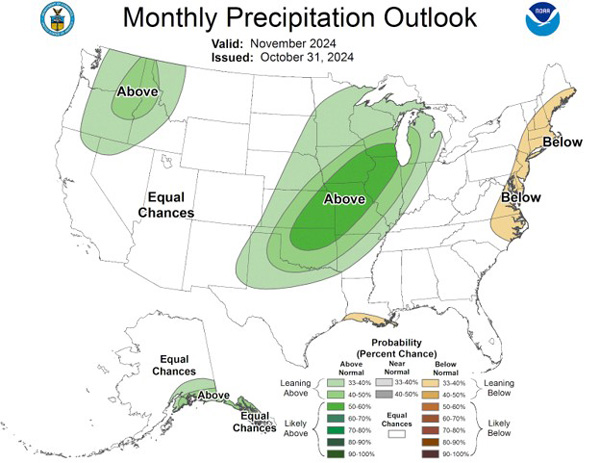
Figure 3. The Climate Prediction Outlook for November 2024 precipitation issued on October 17, 2024 (top) and then updated on October 31, 2024 (bottom).
The moisture forecast
The evolution of the eastern Pacific, or El Niño Southern Oscillation (ENSO), has been uncertain for this winter. Models have continued to wiggle around a potentially weak but short-lived La Niña (Figure 4). While it is usually good for us not to have the drier and warmer conditions associated with La Niña, it also means the outlook is a bit less certain. The north Pacific and the negative PDO status are likely to remain a prominent driver of La Niña-like northwest flow across the Plains. If we continue with active tropics, we can continue to tap into the vital moisture. However, the tropics tend to wane in activity into winter, and thus, precipitation chances will likely decrease as a result. This isn’t to say we will be completely dry. We will just see a more “normal” type of precipitation pattern for the winter months. Keep in mind, winter is the driest time of the year for Kansas.
Figure 4. Current El Niño Southern Oscillation status (red star) and forecast model projections into 2025. The black arrow shows the general model trend barely reaching La Niña in December/January/February (DJF) and then returning back towards Neutral conditions.
The decrease in tropical moisture over the next week is the first sign that true winter is beginning to show its face. In the wake of a powerful system early next week, cold air will stream southward into the state. This will set up the first below-normal temperature period for Kansas for some time. This cold air in northwest flow (typical of the negative PDO) will result in much drier air residing over the region into December (Figure 5). This is the overall pattern of which we expect to be fairly common this winter. Kansas will likely remain on the edge of the coldest air to our north frequently. This delineation will also be integral in determining who sees above-normal moisture (to our north, most likely) and drier-than-normal conditions (likely to our south). Any subtle change in the jet stream over a long duration of time will result in a shift in those conditions to impact Kansas.
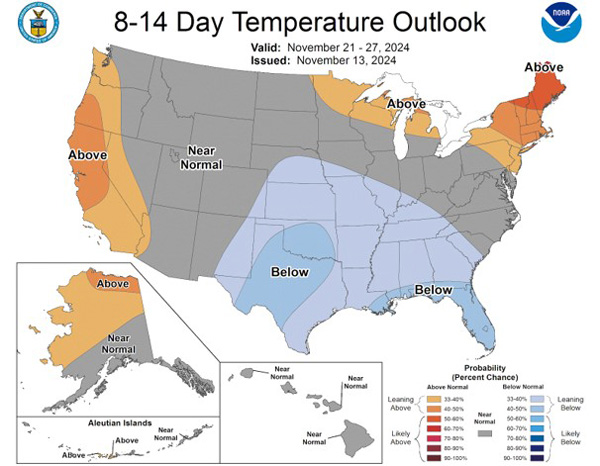
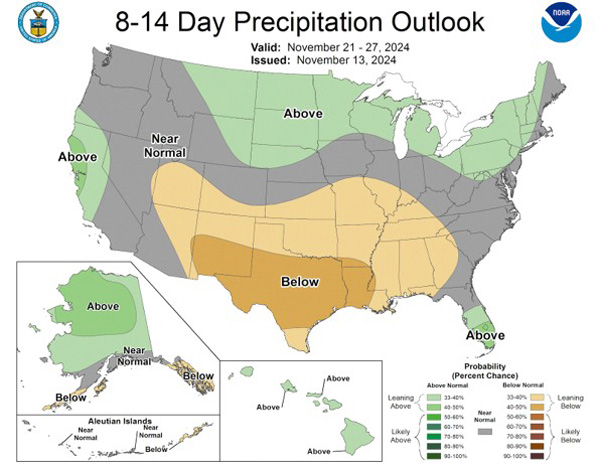
Figure 5. Climate Prediction Center temperature (top) and precipitation (bottom) for November 21-27, 2024.
Eyes to the north
One such potential fly in the ointment is the Polar Vortex. So far this season, the vortex is strong, keeping cold air pent up to our north (in the Arctic), and is stronger than normal. An indication of changing conditions is increasing snow cover over Eurasia. Snow cover at/above normal allows cold build-up that could result in stronger lobes of the vortex as it breaks down mid-winter, pushing much colder air southward. Currently, values are tracking near last year’s numbers (Figure 6). Last year resulted in one episode of much colder than normal temperatures in January. The door appears open, with the combination of the negative PDO, to allow for one (or likely more) potential cold air outbreaks this winter. While overall, we still believe that winter temperatures will follow the persistent trend over the last 30 years of warmer than normal conditions, the setup is favorable for colder temperatures than we observed last year. Keep in mind that these episodes of below-normal temperatures are usually characterized by very dry air and are not conducive to moisture. Regardless, cold air is a primary ingredient for snow. However, with weak La Niña and the persistent northwest flow, conditions are not ideal for at/above normal snowfall for the season outside of one or two storms (which can influence the seasonal total).
The frequency of bigger storm systems is expected to increase in late winter. This is typical for the weak La Niña and negative PDO winters and will be enhanced at the onset of colder periods. This will result in an increase in wind events into the spring. Weak La Niñas following an at/above normal growing season precipitation year are typically favored for an increase in Kansas wildfires. The higher-than-normal fuel loading areas combined with less snow (to lay down the grasses), an increase in winds, and potential dry late winter conditions are a recipe for an above-normal fire season.
Figure 6. Eurasia snow cover this year (red) compared to previous years via NOAA NESDIS satellite imagery.
The bottom line
Recent moisture has improved soil moisture profiles statewide and will likely lead to decent moisture into early spring. Despite this, trends toward drier-than-normal conditions are still favored for this winter. Warmer than normal temperatures will prevail, but more cold snaps are expected than we observed last year. Kansas remains in the middle ground (Figure 7) between wet/dry and warm/cold conditions, and any subtle long-duration shift in the storm track may result in a different outcome for Winter 2024-2025.
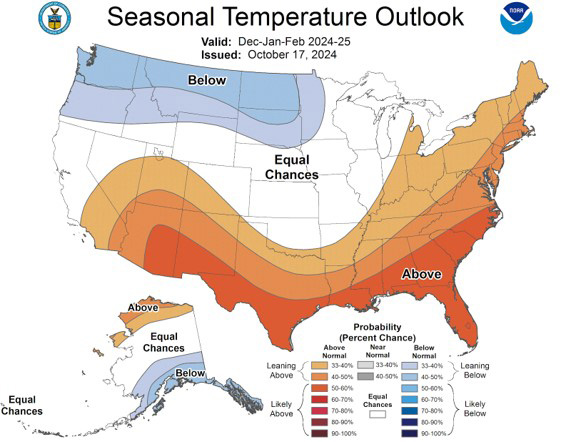
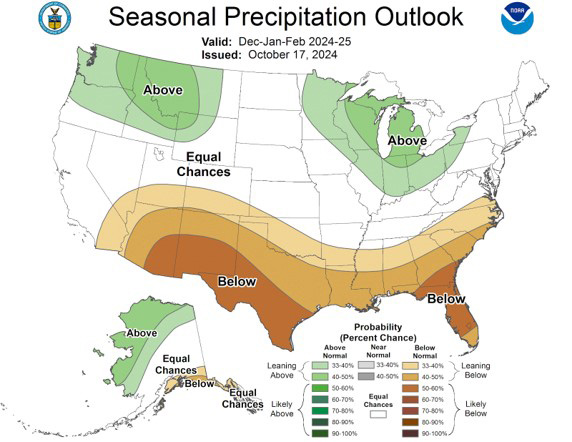
Figure 7. Climate Prediction Center outlook for December/January/February 2024-2025 for temperature (top) and precipitation (bottom).
Matthew Sittel, Assistant State Climatologist
msittel@ksu.edu
Chip Redmond, Kansas Mesonet
christopherredmond@ksu.edu
Tags: weather Climate winter outlook