Moderate or severe drought is prevailing through much of the Corn Belt and many areas of Kansas, Missouri, and Nebraska are experiencing extreme drought. Although the degree to which drought will affect 2023 crop prices is still uncertain, research on historical impacts of extreme heat[1] on farm profitability provides evidence that Kansas farms could be impacted by increasing frequency and extremity of severe weather in the future.
While Kansas farmers are no strangers to adverse weather, extreme heat has been increasing in Kansas over the last few decades. Figure 1 shows that extreme degree-days, henceforth referred to as EDD (a measure used by researchers to account for both the duration and intensity of temperatures above a threshold, defined as 32°C or 89.6°F in our study)[2], have increased over the past 4 decades across Kansas. Kansas had an average of 54 EDDs per year in the growing season (April-Sept) from 1981-1990, which increased to 57 EDDs during 2011-2020. Meanwhile, USDA reports total net cash income for Kansas farms has ranged from $1.5 billion to nearly $6 billion since 2000, which reflects both price and yield volatility. Given that weather volatility and droughts are expected to increase (Masson-Delmotte, 2021), we have sought to quantify the historic relationship between farm income and extreme heat, as well as factors that have historically mitigated the impacts of extreme heat. Our research shows Kansas farm income is very sensitive to extreme heat. However, both (1) farm practices and (2) crop insurance have partially mitigated the impacts of extreme heat historically.
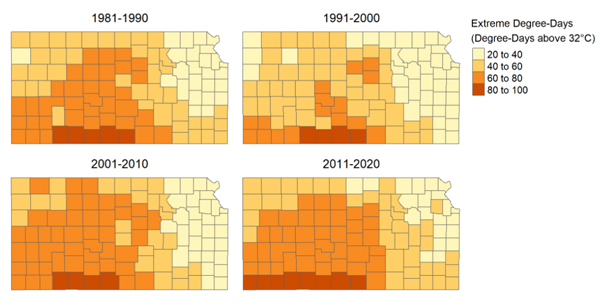
Figure 1. Extreme degree-days have been increasing in Kansas.
Note: 32 degrees Celsius is equivalent to 89.6 degrees Fahrenheit; this study uses a measure of extreme degree-days that accounts for both the period of time over this threshold and level above this threshold.
Summary of data and methods
Our study uses a farm-level panel dataset from the Kansas Farm Management Association (KFMA), which spans four decades (1981-2020) and covers thousands of farms. The KFMA offers accounting and financial analysis services for farmers. KFMA's affiliation with Kansas State University has led to a partnership for the provision of farm-level data for research and outreach purposes, including tracking farm financial health across the state.
We use panel econometric methods to analyze the impact of extreme heat (EDD) on different measures of farm income[3]. This analysis controls for farm-specific factors and characteristics, as well as local precipitation (rain) and year, which accounts for changes in commodity markets, policies, etc. that are common across all farms. To understand the degree to which farm practices and policies play a role in mitigating extreme heat, we use the same modeling approach to analyze the impact of extreme heat on inventories, government payments, and crop insurance. We also quantified the role of irrigation access in buffering extreme heat. More details on our methodology can be found here.
Findings
While our analysis was conducted with EDD, we convert our primary findings to increases in temperature for ease of interpretation.[4] We find that during our study period, 1°C (1.8°F) of additional warming decreased gross income by 7% and net farm income by 66%. Comparing the monetary value of temperature-driven losses of the two income measures reveal that for an average farm, net income loss is roughly 1.6 times the size of gross income loss --- a 1°C warming leads to $34,650 and $54,119 decline in gross income and net income, respectively. The disparity between the percentage effect of warming can be partially explained by tight profit margins experienced by farm operations, as a small share of gross farm income is typically a large share of profit (net farm income). The average real gross and net farm income during the study period is $494,955 and $82,005, respectively. Likewise, the higher dollar value effect of extreme heat on net farm income partially reflects increasing expenses.
Table 1 – Kansas farm profits take a large hit in years with more extreme heat
|
|
Gross Farm Income |
Net Farm Income |
|
Impact of 1°C (1.8°F) warming |
-7% |
-66% |
|
Impact of 1°C (1.8°F) warming |
-$34,650 |
-$54,119 |
|
Note. Impact in dollars relates to the average farm in our sample (having average real gross and net farm income of $494,955 and $82,005, respectively. During the 2012 Midwestern drought, temperatures were approximately 1.6C (2.9F) warmer than the average of our study period. |
||
Table 2 – Net income losses would be much larger without crop insurance and farm-level practices
|
|
Policies and farm practices |
||
|
|
Crop Insurance |
Adjustment in crop inventory |
Irrigation use |
|
Proportion of net income loss from extreme heat prevented |
51% |
16% |
37% |
|
Note. Irrigation use is defined as farms with a greater than average proportion of cropland as irrigated. The numbers in the table should not be added together, because the effect associated with irrigation use is estimated separately from the other two and can change depending on how we define 'irrigation use'. |
|||
Farm practices that can mitigate extreme heat include drawing down inventories. We find that the value of crop inventory stock declines after farms experience extreme weather, which likely reflects farms selling off inventory from the previous marketing year to make up for low yields. This form of inventory adjustment shields 16% of the net income loss due to extreme heat. Government payments don’t have any relationship with extreme heat in the current year but do have a strong relationship with government payments two years prior. This is consistent with Title 1 (ARC and PLC, currently) and disaster payments often being authorized or paid out well after the year that they are incurred. On the other hand, crop insurance payouts have a strong relationship with extreme heat in the current year, buffering approximately 51% of the net income loss as a result of extreme heat. This is consistent with crop insurance indemnities typically being paid out in the year a loss is incurred, or immediately in the subsequent year.
Farms that have access to irrigation may be less affected by extreme heat. A significant portion of western Kansas overlaps with the High Plains Aquifer (Figure 2), allowing us to examine the buffering impacts of irrigation on net income loss under extreme heat conditions. We found that highly irrigated farms experience approximately 37% less net income loss compared to other farms. Kansas is currently facing declining groundwater availability and biophysical and regulatory limitations on water availability are likely to restrict irrigation in the future.
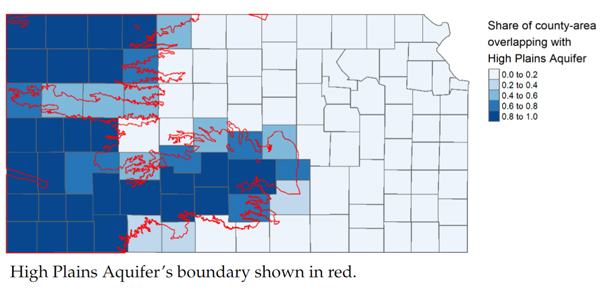
Figure 2. Many Kansas counties have access to the High Plains Aquifer.
Discussion
Our findings are consistent with the experience of Kansas farmers, many of whom experienced extreme drought in 2022. Average 2022 farm income, as reported by the Kansas Farm Management Association (KFMA), was near the 5-year average and higher than 2018 and 2019. This was partially due to crop insurance and government payments accounting for 72% of accrual net farm income for KFMA farms. However, substantial regional variation occurred across the state: net insurance payouts were negative[5] for the average KFMA farm in northeast Kansas, which was much less affected by drought. On the other hand, crop insurance payouts made up nearly all of net farm income for KFMA farms in northwest and southeast Kansas, which experienced extreme drought.
Kansas farm income is highly sensitive to extreme heat. This impact is partially mitigated by both farm practices and crop insurance. From a policy perspective, crop insurance is working as designed and shields producers from some of the effects of extreme heat or extreme weather more generally. However, as with any policy intervention, there may be positive or negative unintended consequences. Whether government policy impedes the long-term adaptation of U.S. agriculture to extreme weather is an ongoing debate.
Our research shows that the financial impact of extreme heat is high, suggesting that projected increases in extreme heat could pose risks to gross and net farm income. Further, the financial impact of weather shocks on farm operations is transmitted to lenders, insurance companies, the Federal Crop Insurance Program, agribusiness, and rural communities. How producer, industry, and government actions play a role in facilitating adaptation to extreme weather is an important topic for future research and policy design.
Reference: Masson-Delmotte, V. P. (2021). Climate change 2021: the physical science. Contribution of working group I to the sixth assessment report of the intergovernmental.
Acknowledgements: We are grateful for the cooperation of KFMA membership and staff and the Environmental Defense Fund for supporting this research. This research was also supported in part by the USDA National Institute for Food and Agriculture Award number 2021‐67023‐33816.
Editor’s note: This article originally was published online at https://farmdocdaily.illinois.edu/2023/07/extreme-heat-and-kansas-farm-income.html.
Sajid, O., J. Ifft, A. Ortiz-Bobea and V. Gauthier. "Extreme Heat and Kansas Farm Income." farmdoc daily (13):138, Department of Agricultural and Consumer Economics, University of Illinois at Urbana-Champaign, July 26, 2023.
Jenny Ifft, Agricultural Economist – Kansas State University
jifft@ksu.edu
Osama Sajid – Cornell University
Ariel Ortiz-Bobea – Cornell University
Vincent Gauthier – Environmental Defense Fund
[1] Extreme heat and drought are not the same thing but are correlated. We use “extreme heat” in our research because it is a consistent measure of extreme weather that is more appropriate for statistical analysis.
[2] EDD is a two-dimensional measure of thermal time, computed as the product of temperature (in 1° C increments) above 32° C and the exposure (in days) at each of those temperature points. EDD is similar in construction to ‘growing degree days’. EDD is considered a more accurate measure of extreme heat than just duration of higher temperatures (the number of days above 32°C), because it also accounts for intensity, or gives higher weight to higher temperatures --- the farther the temperature is from 32° C, the larger is the value of EDD. The full impact of extreme heat cannot be captured without accounting for both duration and temperature.
[3] Gross farm income captures all sources of farm income in a year and net farm income is gross farm income less expenses. These are accrual measures of income and include government payments, crop insurance payments, and any income earned (or lost) through inventory adjustment.
[4] We calculate this through a recomputed measure of EDD by using a reconstructed dataset where we increased the temperature by 1˚ C at all times.
[5] Negative net payouts means that premiums were higher than indemnities.
Tags: drought high temperatures crop insurance hot weather farm stress