As crops are actively growing, it is critical to regularly monitor fields. For example, most of the Kansas corn crops are in the tasseling (VT) to grain filling (R1-R4) stages right now, which are the critical stages for determining final yield. During the transitional phase from vegetative to reproductive development (VT), any possible stresses such as drought, flooding, disease, pests, and nutrient deficiencies during this window may lead to fewer kernels per ear, lighter test weight, and ultimately lower crop yield. Therefore, proper monitoring during this phase can help with early stress detection and crop yield estimation.
Thanks to modern precision agriculture technologies such as Unmanned Aerial Vehicles (UAVs), commonly called ‘drones’, fields can be monitored more rapidly, frequently, and more precisely compared to traditional visual inspection by walking the field. Visual inspection is time-consuming, labor-intensive, and potentially less precise/accurate when limited to a small area of the field, as in fields with limited accessibility, or when fields are highly variable. Moreover, crops like corn are tall, dense, and have a closed canopy when they reach tasseling and begin grain filling, which makes field scouting and visual inspection more difficult. In these scenarios, drones can be used to detect the pattern and uniformity of crop growth and identify the problem areas more quickly and precisely.
What is drone-based remote sensing?
Drone-based remote sensing involves using a drone equipped with a sensor (camera) to collect images and information by flying over your farm or field without touching the crop or ground. The camera senses light color reflectance from below across a range of wavelengths, both visible and invisible to human eyes. Visible light includes red, green, and blue light. However, it is near infrared (NIR) light, which is not visible, that can be used to detect plant growth and vigor. When the plant is green and healthy, it reflects more NIR light and absorbs red light for photosynthesis. However, when a plant is stressed or less green, the reflection pattern of NIR is just the opposite, as it reflects less NIR light. Such light reflectance values from plant canopies are also used in various equations to calculate vegetation indices (VIs) to assess plant health, greenness, biomass, etc.
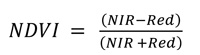
One of the most common and widely used indices in precision agriculture is the Normalized Difference Vegetation Index (NDVI), which is calculated using the reflectance value of NIR and Red light as in the equation below:
The value for NDVI usually ranges from -1 to +1. In general,
- +0.6 to +1.0 = Very healthy, dense vegetation coverage
- +0.2 to +0.5 = Moderate crop health and canopy coverage.
- 0 to +0.2 = Stressed plants or bare soil,
- Less than 0 = Water, snow, or non-vegetated surfaces.
Using these thresholds, crop growth can be monitored, and areas of the field that need specific attention can be identified to support decision-making. However, one issue with NDVI maps at the later growth stage of the crop is ‘NDVI Saturation’. This is the crop growth stage at which NDVI reaches the peak level, and it remains the same even when chlorophyll content changes. In this case, Normalized Difference Red Edge (NDRE) indices can be more reliable, as it is more sensitive than NDVI to small changes in chlorophyll content. The NDRE can be calculated using the following equation:
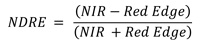
NDRE values for crops typically range from 0 to 1. Values closer to 1 indicate higher chlorophyll content in the leaves, while values closer to 0 suggest lower chlorophyll content, plant stress, or reduced canopy coverage.
Drones in crop growth monitoring: A real-world scenario
Crop growth and canopy vigor can be monitored using drone-based imagery with various vegetative indices, such as NDVI or NDRE data derived from such imagery. For example, drone imagery was collected at the silking to grain filling growth stages of corn. From this, NDVI (Figure 1a) and NDRE (Figure 1b) maps were generated for a detailed view of corn canopy conditions and variability across the field.
The NDVI values of the corn crop ranged from 0.79 to 0.94, indicating dense canopy cover and high biomass. However, some parts of the fields along the edges or certain low spots seem to have lower NDVI values, indicating the possibility of water stress, nutrient deficiency, or other issues; therefore, such areas should be prioritized for ground inspections to identify or confirm the cause of stress before taking any action. Moreover, NDVI may begin to saturate at this stage, masking subtle differences in plant health. Therefore, the NDRE map can provide a complementary perspective.
Compared to NDVI, NDRE shows a wider range of variability within the green zone and is more sensitive to chlorophyll concentration in upper leaves. Since NDRE is less prone to saturation compared to NDVI at the mid to later growth stage when there is high biomass and dense canopies, it is more effective for earlier detection of stress.
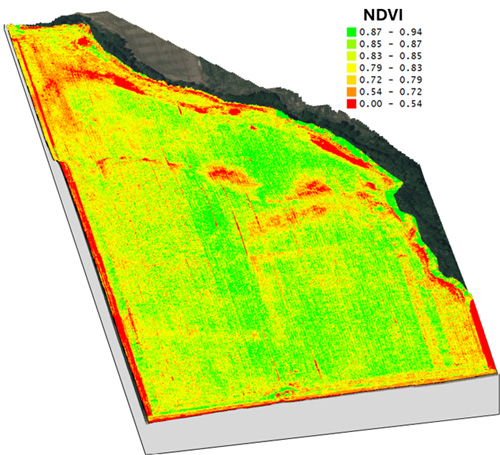
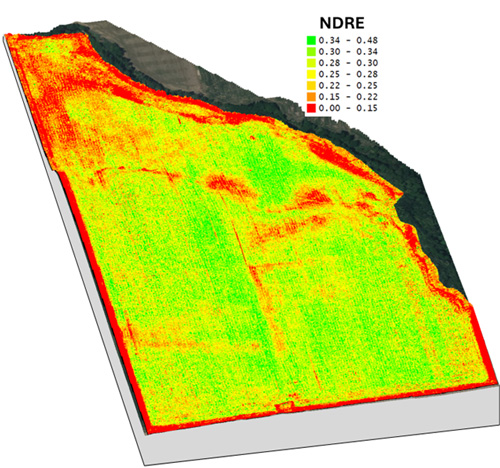
Figure 1. Spatial variability of corn canopy health as indicated by NDVI (top image) and NDRE (bottom image) maps collected on July 29, 2025. NDVI images were overlaid on a LiDAR-based digital elevation model (DEM) to visualize and analyze the spatial variability in NDVI-driven crop growth patterns. Image credit: Deepak Joshi & Flickner Innovation Farm.
Conclusion
Visual inspections by walking around the field are quite challenging as they are time-consuming, labor-intensive, and potentially less precise/accurate when limited to a small area of the field. Moreover, such visual inspection or scouting is even more impossible for crops like corn, as they are tall, dense, and have a closed canopy when they reach tasseling and begin grain filling. Therefore, drone-collected imagery at the later growth stage of the crop can help to understand the temporal and spatial variability in crop growth and vigor and yield estimation.
Deepak Joshi, Precision Ag Extension Specialist
drjoshi@ksu.edu
Logan Simon, Southwest Area Agronomist
lsimon@ksu.edu
Tina Sullivan, Northeast Area Agronomist
tsullivan@ksu.edu
Tags: crop scouting drones precision agriculture remote sensing