The state of Kansas has a reputation as being a uniformly flat state, but anyone who has spent time here knows there are a few exceptions. There are multiple areas of hills in the state, such as the Flint, Smoky, and Gypsum, and valleys carved out by rivers that can be easily seen on a topographic map (Figure 1) of the state. In general, much of Kansas is indeed flat. However, the apparent evenness of the topography is misleading, as there is a gentle increase in elevation from east to west across the state. The lowest elevation in the state is 679 feet in Montgomery County, south of Coffeyville, along the Verdigris River. The highest point is 4,039 feet in Wallace County, in west central Kansas, near the Colorado border. This high point has an appropriate but amusing name: Mount Sunflower. As it turns out, Mount Sunflower isn’t a towering peak but just a high spot on the plains.
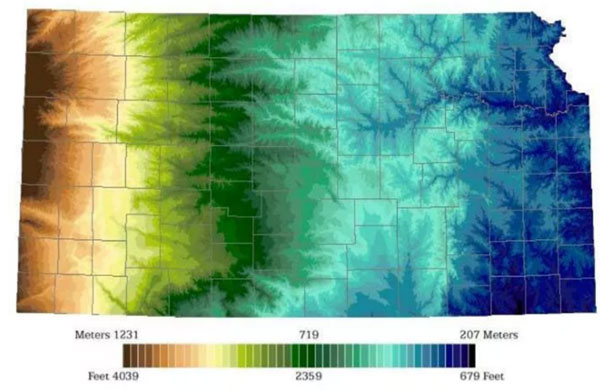
Figure 1. Elevation map of Kansas.
Topography affects precipitation distribution
Topography influences the distribution of precipitation across Kansas. Western Kansas lies in a “precipitation shadow,” as descending airflow on the lee side of the Rockies results in drier air that eventually spreads east into Kansas. Further east, the Gulf of Mexico provides an ample source of moisture that gets transported north, first arriving in far southeastern Kansas and then spreading north and west on southerly winds that commonly blow across much of the state. The westward increase in elevation in Kansas is a hindrance to effectively spreading the Gulf moisture into the western half of the state. Thus, the topography of Kansas plays a part in the uneven distribution of precipitation. Average annual precipitation amounts are lowest in the west and highest in the east (Figure 2). The counties along the Colorado border average from 17 to 19 inches of precipitation annually. The lowest average is 17.36” in both Stanton and Morton Counties in far southwestern Kansas. Along the Missouri border, annual averages range from a low of 36.31” in Doniphan County in the far northeast to a maximum of 45.30” in Cherokee County, our southeasternmost county. Cherokee is one of twelve counties that average 40 or more inches of precipitation annually. Lines of equal precipitation, known as isohyets, change from vertical to diagonal as you move from west to east across the state, the direct influence of the Gulf moisture source, which lies to the southeast of Kansas.
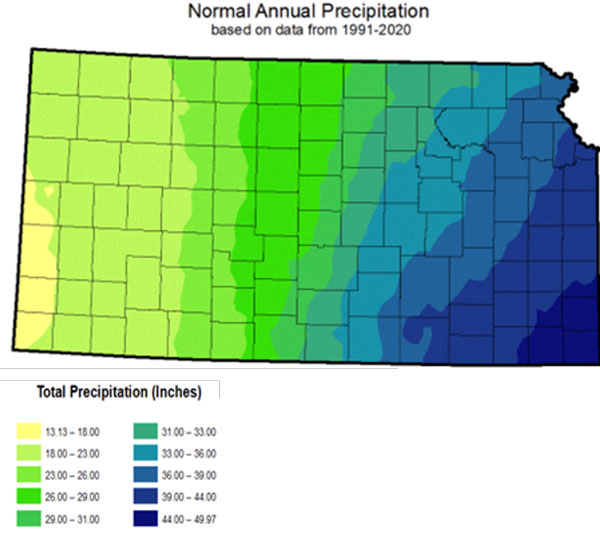
Figure 2. Average annual precipitation across Kansas. Source: climate.k-state.edu.
Precipitation varies based on time of year
In addition to the spatial differences in precipitation distribution, there is a temporal variation in precipitation as well (Table 1). January is the driest month on average in all divisions except southwest Kansas, where the driest average is in February. On average, May is the wettest month in the eastern two-thirds of Kansas. June is typically the wettest month in the southwest, while July averages the most in both northwest and west central Kansas. The annual increase of precipitation in spring is followed by a general decrease through summer into autumn, but the rise and fall in each of Kansas’ nine climate divisions is far from the smooth ride one might experience on, say, Interstate 70. Buckle up; let’s take a road trip across the state and see how Kansas’ average precipitation varies by location and date.
In the following graphics, weekly average precipitation is displayed for three climate divisions at a time for eastern, central, and western Kansas. These were constructed using daily precipitation averages for 165 different locations around the state, calculated by the National Centers for Environmental Information for the 30-year period 1991 to 2020. The individual locations were grouped based on climate division, and the daily averages were summed to generate 7-day averages.
Table 1. Average monthly and annual precipitation in each of Kansas’ nine climate divisions.
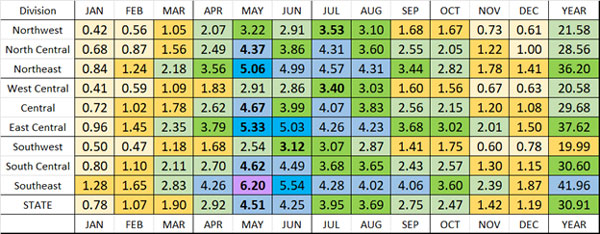
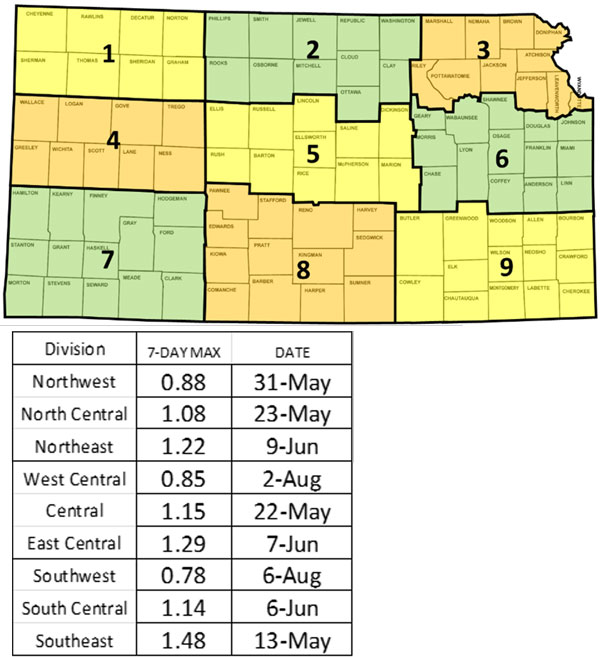
Figure 3 and Table 2. List of the highest 7-day average precipitation totals and their dates of occurrence in each of Kansas’ nine climate divisions (Table 2), the boundaries of which are shown on the map (Figure 3).
Our first stop is eastern Kansas (Figure 4), the wettest part of the state, home to Topeka, Emporia, Pittsburg, Manhattan, and Lawrence, plus the western Kansas City metropolitan area. All three of the eastern divisions have their lowest weekly average precipitation in mid-January. This is also the time of year when average daily low temperatures are at their minimum in the state (the coldest average daily low temperature across Kansas is 18.5°F from January 13 through January 21). Cold air can’t hold as much water vapor as warm air, so in winter there’s less moisture available to generate precipitation, hence the lower amounts on average. There is a steady increase in average precipitation through February and March, with a rapid rise in 7-day totals in April into May. Southeast Kansas has not only the state’s maximum 7-day average at 1.48” (Table 2), but it also reaches that maximum earlier than any other division, peaking on May 13 (Note: references to individual dates in this article refer to the last day of a weekly value; May 13 refers to the 7-day period from May 7 through May 13).
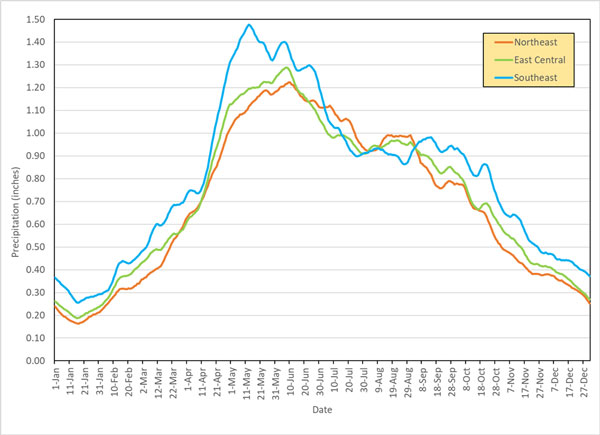
Figure 4. Average 7-day precipitation during the calendar year in Kansas’ three eastern climate divisions. Data source: NCEI.
Further north, the peak average in northeast and east central Kansas doesn’t occur for another three to four weeks; the maximum 7-day average is June 7 in east central and June 9 in northeast Kansas. The maximum averages are lower in these two divisions than in the southeast. In the second half of the year, averages are on the decrease in all three divisions, but this descent is not a smooth one. Rather, it’s somewhat of a bumpy ride on the way down, with a few “rolling hills” along the way, not unlike the terrain in a few parts of Kansas. These undulations lead to some surprising results in the average precipitation data. Despite averaging the lowest annual precipitation of the three eastern divisions, the wettest average in the state in both July and August is in northeast Kansas. There are secondary peaks in weekly averages in all three divisions in late summer. While not dramatically higher, the increases are such that southeast Kansas averages slightly more precipitation in September (4.06”) than it does in August (4.02”).
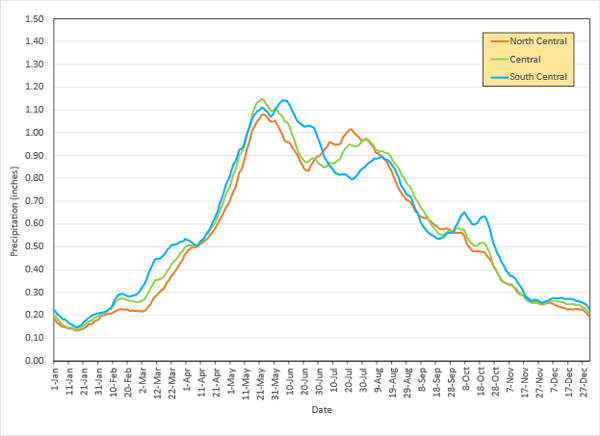
Figure 5. Average 7-day precipitation during the calendar year in Kansas’ three central climate divisions. Data source: NCEI.
Now, let’s roll west into central Kansas, home to Concordia, Salina, Hutchinson, Wichita, and Medicine Lodge. Elevations are slightly higher in this division than further east, particularly west of 98° west longitude. The influence of the Gulf of Mexico is less in this part of the state, plus the air is usually less humid in central than in eastern Kansas, thanks to drier air being advected eastward from the west. As a result, precipitation across Kansas’ three central climate divisions (Figure 5) averages less than in the east. The maximum 7-day amount occurs in late May in both north central (May 22) and central (May 23) Kansas but around two weeks later in south central Kansas (June 6). This earlier peak results in central Kansas averaging the most precipitation of the three divisions in May, with south central wettest on average in June.
An interesting pattern is evident in the central divisions during mid-summer. In north central and central Kansas, average precipitation decreases from the late May peak until late June, then increases again for a few weeks. There is a similar increase in totals in south central Kansas that commences a few weeks later. As a result, north central is the wettest of the three divisions in July, while central Kansas is the wettest in both August and September. A short-lived average increase occurs in south central Kansas in October, which is the wettest division of the three from October through the winter months into April.
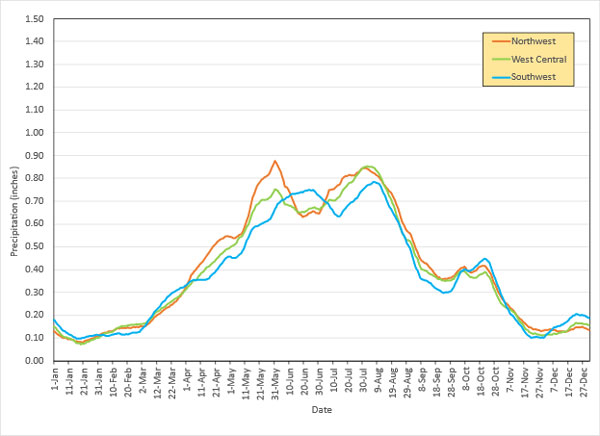
Figure 6. Average 7-day precipitation during the calendar year in Kansas’ three western climate divisions. Data source: NCEI.
Our last stop on this road trip is western Kansas (Figure 6), home to Goodland, Colby, Tribune, Dodge City, and Garden City. Weekly averages are lower than those in the eastern and central divisions. There are two distinct peaks in amounts during the year, but the secondary peak is much more pronounced in this division than it is in central Kansas. In northwest Kansas, the highest 7-day average of the year comes with the first peak, occurring on the last day of May. Further south, the second peak results in higher averages than the first, and as a result, the highest 7-day amounts are in early August in both west central (Aug. 2) and southwest Kansas (Aug. 6). All three of the western divisions see a notable increase in weekly averages from late September into late October, and also a slight increase during December. This results in a pair of oddities for southwest Kansas: October averages more precipitation than September, and December’s average is more than November’s!
As we know, precipitation totals aren’t consistent from year to year, making for a never-ending challenge for those with agricultural interests in the state. May is the wettest month on average in Kansas, so we are in prime time as we speak for receiving moisture that is critical to those raising crops and livestock. Thanks for coming along with me on this virtual road trip!
Matthew Sittel, Assistant State Climatologist
msittel@ksu.edu
Tags: weather Climate precipitation rainfall