In the last five weeks, Kansas has endured two stretches of extreme heat. The first occurred during the last 10 days of July. The second heat wave was even hotter than the first. It began with a vengeance on August 19. We detailed the summer superlatives from August 19 in an article last week. For this week, we take a look at the entirety of the 7-day stretch that ended on August 25, when a cold front displaced the persistent ridge of high pressure that had parked itself over the central United States. While not the longest run of 100-degree weather ever recorded, the 7-day stretch was the longest in over a decade at many locations. Table 1 details specifics of the recent heat wave at 24 observing sites across Kansas with over 50 years of data. For three locations, their highs on August 19 were the warmest ever observed, with Manhattan Airport’s 115° the hottest temperature observed in the state since June 2012, when Norton Dam reached 118°.
Table 1. Airport, automated, and cooperative sites that recorded 7 consecutive days of highs 100° F or greater from August 19th through August 25th, 2023. Inclusion is limited to stations with at least 50 years of data.
|
Location |
County |
Aug 19-25 High (°F) (Date) |
Warmest Day Since |
Longest Run of 100°+ Days Since |
Record Longest Run of 100° Days (Year) |
Year in which Records Began |
|
Ashland |
Clark |
107 (8/19) |
7/2022 |
2015 |
23 (1954) |
1900 |
|
Beloit |
Mitchell |
106 (8/21) |
6/2012 |
2012 |
14 (1980) |
1893 |
|
Clay Center |
Clay |
110 (8/19) |
7/1980 |
2012 |
21 (1913) |
1902 |
|
Concordia |
Cloud |
109 (8/21) |
7/2023 |
2000 |
18 (1934) |
1885 |
|
Cottonwood Falls |
Chase |
112 (8/19) |
7/1980 |
2012 |
20 (1934) |
1902 |
|
El Dorado |
Butler |
111 (8/19) |
7/1954 |
2011 |
21 (1936) |
1893 |
|
Emporia |
Lyon |
112 (8/19) |
8/2011 |
2012 |
15 (2000) |
1950 |
|
Healy |
Lane |
108 (8/25) |
8/2023 |
2023 |
15 (1913,1934) |
1901 |
|
Herington |
Dickinson |
110 (8/19) |
7/1980 |
2003 |
17 (1980) |
1926 |
|
Hill City |
Graham |
107 (8/23) |
7/2023 |
2012 |
18 (1934) |
1907 |
|
Hutchinson |
Reno |
110 (8/19) |
8/2011 |
2012 |
14 (1954,2000) |
1948 |
|
Lincoln |
Lincoln |
109 (8/19) |
7/2023 |
2012 |
25 (1983) |
1912 |
|
Manhattan |
Riley |
115 (8/19) |
Highest |
2012 |
11 (2000,2003) |
1960 |
|
Melvern Lake |
Osage |
112 (8/19) |
Highest |
2012 |
17 (1980) |
1973 |
|
Milford Lake |
Geary |
112 (8/19) |
Highest |
2012 |
13 (1980) |
1965 |
|
Minneapolis |
Ottawa |
108 (8/25) |
7/2023 |
2012 |
20 (1936) |
1892 |
|
Plainville |
Rooks |
110 (8/20) |
7/2022 |
2015 |
18 (1934) |
1904 |
|
Russell |
Russell |
106 (8/19) |
7/2023 |
2012 |
17 (1980) |
1949 |
|
Salina |
Saline |
113 (8/19) |
7/2011 |
2012 |
20 (1934) |
1900 |
|
Sedan |
Chautauqua |
112 (8/20) |
8/2011 |
2022 |
25 (1934) |
1893 |
|
Sterling |
Rice |
107 (8/19) |
7/2022 |
2012 |
16 (1980) |
1893 |
|
Topeka |
Shawnee |
111 (8/19) |
8/2011 |
2011 |
19 (1901,1936) |
1887 |
|
Wellington |
Sumner |
108 (8/19) |
8/2012 |
2012 |
21 (1934,1936) |
1894 |
|
Wichita |
Sedgwick |
111 (8/19) |
7/2012 |
2012 |
20 (1936) |
1888 |
Summary of Kansas Mesonet Stations
The intensity of the heat wave is also evident in the observations made by the over 80 stations that comprise the Kansas Mesonet. All but two sites exceeded 100° at least once between the 19th and 25th, and over 30 of them reached the 100-degree mark all 7 days, mostly in central and eastern Kansas (Figure 1). The most intense heat was focused in east central and northeast Kansas, where the hottest readings exceeded 110° at ten locations (Figure 2).
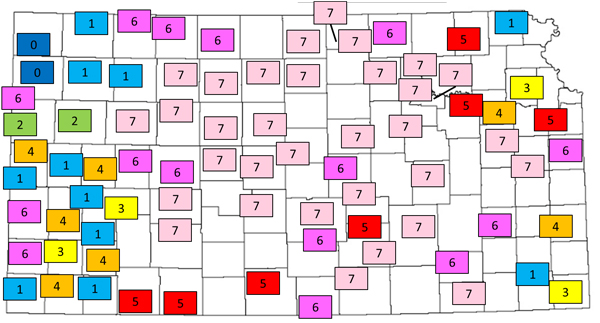
Figure 1. The number of days between August 19 and 25 when the temperature reached at least 100°F across the Kansas Mesonet.
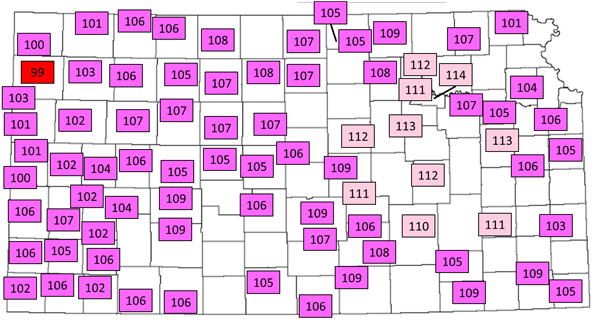
Figure 2. The hottest temperature at each Kansas Mesonet site between August 19 and 25, 2023.
The heat was more manageable in western Kansas, where dew points stayed at slightly more comfortable levels than in the east. Many places in eastern Kansas endured dew points over 80° (Figure 3) which led to dangerously high heat indices (Figure 4). The National Weather Service issued and then extended Excessive Heat Warnings for much of the state over multiple days during the heat wave, as heat indices peaked at over 120° in a few spots in far eastern Kansas.
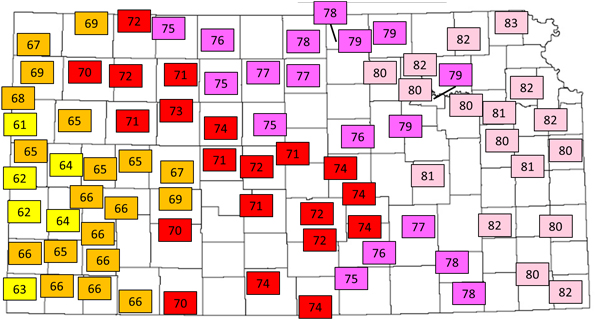
Figure 3. The highest dew point, based on hourly averages, recorded at each Kansas Mesonet site for August 19 to 25, 2023.
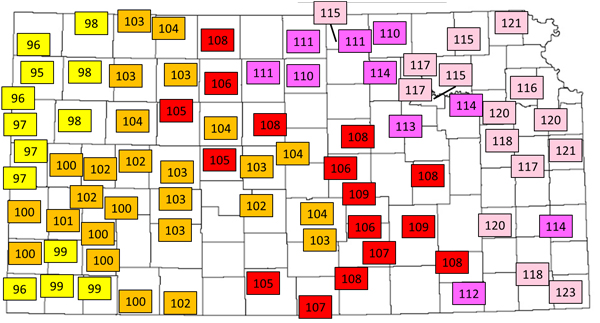
Figure 4. The highest heat index, based on hourly averages, recorded at each Kansas Mesonet site for August 19 to 25, 2023.
Eight Kansas Mesonet sites recorded heat indices at or above heat advisory criteria (105°F) on all 7 days of the heat wave, and five of the eight recorded over 50 hours of heat advisory conditions during the period (Table 2). By contrast, no site in the western third of the state exceeded heat advisory criteria.
Table 2. The Kansas Mesonet sites that recorded the most hours with hourly average heat index greater than or equal to 105° between August 19 and 25, 2023.
|
Rank |
Site |
County |
Number of Days with Heat Index ≥ 105°F |
Number of Hours with Heat Index ≥ 105°F |
Hottest Heat Index Reading (°F) |
|
1 |
Cherokee |
Cherokee |
7 |
54 |
123 |
|
2 |
Olathe |
Johnson |
7 |
53 |
120 |
|
3 |
Hiawatha |
Brown |
7 |
52 |
121 |
|
|
Silver Lake 4E |
Shawnee |
7 |
52 |
120 |
|
|
Woodson |
Yates |
7 |
52 |
120 |
|
6 |
Miami |
Miami |
7 |
43 |
121 |
|
7 |
Ottawa 2SE |
Franklin |
7 |
38 |
117 |
|
8 |
Parsons |
Labette |
7 |
37 |
118 |
|
|
Clay |
Clay |
5 |
37 |
114 |
|
10 |
Manhattan |
Riley |
6 |
36 |
117 |
|
|
Rocky Ford |
Riley |
5 |
36 |
117 |
Because of the very hot temperatures during the heat waves, many locations have already had more 100-degree days than normal (Table 3). With two or fewer 100-degree days on average after August 25th, those locations are guaranteed to finish the year with an above-normal count. As for 90-degree days, ten or more such days could still occur this year. A future report will detail the final 2023 counts.
Table 3. The number of days with highs at or above 90° and 100° so far in 2023, as of August 25, along with average counts, for select locations around Kansas.
|
Location |
County |
Number of Days with Highs ≥ 90°F |
Number of Days with Highs ≥ 100°F |
||||
|
2023 (as of Aug. 25) |
Average |
2023 (as of Aug. 25) |
Average |
||||
|
Jan. 1 – Aug. 25 |
Aug. 26 – Dec. 31 |
Jan. 1 – Aug. 25 |
Aug. 26 – Dec. 31 |
||||
|
Concordia |
Cloud |
51 |
41 |
9 |
15 |
6 |
1 |
|
Dodge City |
Ford |
46 |
57 |
14 |
11 |
13 |
1 |
|
Emporia |
Lyon |
52 |
36 |
8 |
15 |
5 |
0 |
|
Garden City |
Finney |
37 |
58 |
16 |
2 |
14 |
2 |
|
Goodland |
Sherman |
30 |
43 |
9 |
4 |
6 |
0 |
|
Hutchinson |
Reno |
60 |
50 |
13 |
21 |
11 |
1 |
|
Manhattan |
Riley |
38 |
47 |
12 |
11 |
9 |
0 |
|
Parsons |
Labette |
59 |
38 |
9 |
18 |
4 |
1 |
|
Salina |
Saline |
55 |
55 |
13 |
17 |
14 |
2 |
|
Topeka |
Shawnee |
55 |
41 |
9 |
13 |
5 |
1 |
|
Tribune |
Greeley |
30 |
52 |
13 |
4 |
11 |
1 |
|
Wichita |
Sedgwick |
46 |
52 |
13 |
20 |
11 |
1 |
Matthew Sittel, Assistant State Climatologist
msittel@ksu.edu
Tags: weather Mesonet hot weather